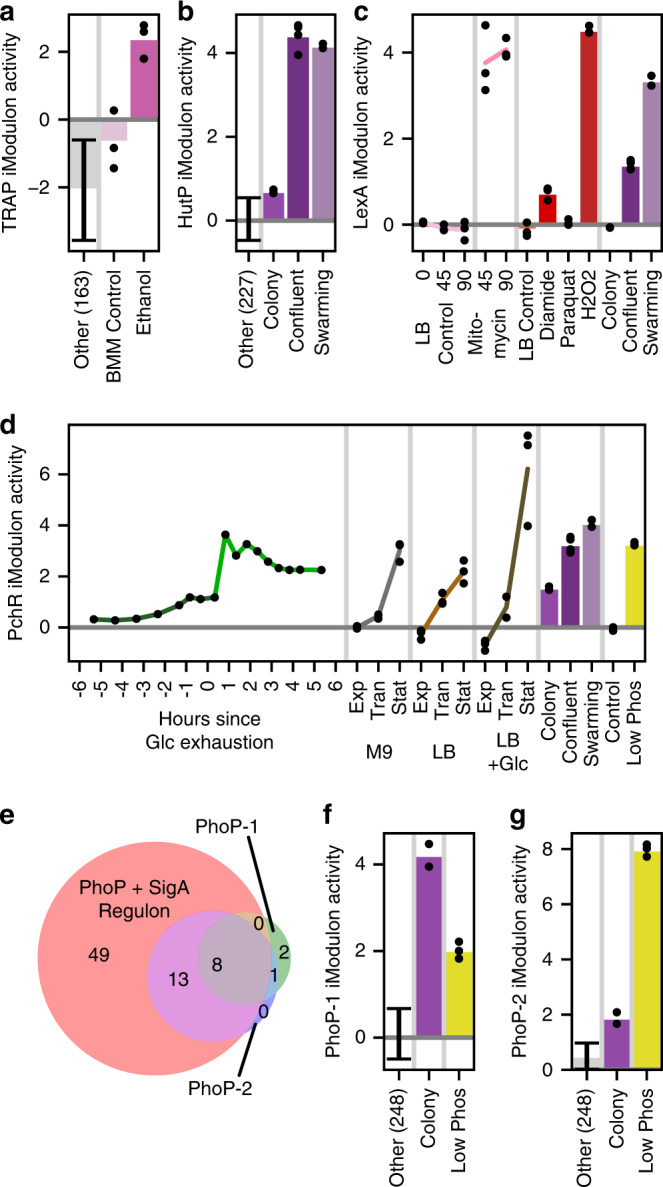
Fig. 2. iModulons provide a range of insights.

Error bars: mean ± standard deviation; black dots indicate separate samples; vertical gray lines separate different experiments in the data set. Unless otherwise stated, “Other” category includes all conditions except sporulation and those shown, with the number of samples included in parentheses. a Tryptophan synthesis (TRAP) iModulon activity, which is unexpectedly elevated by ethanol (Supplementary Fig. 5a). The experiment was carried out in Belitsky minimal medium (BMM). The “Other” category excludes carbon source transition experiments, in which this iModulon exhibits technical noise. b Histidine utilization (HutP) iModulon activity, which is strongest in quorum conditions. c LexA iModulon activity is elevated by DNA damage (mitomycin and peroxide) and in swarming (Supplementary Fig. 5b). d Pulcherrimin (PchR) iModulon activity increases when growth is expected to slow, especially in the stationary phase in rich (LB) media containing glucose (Glc). “Exp”, “Tran” and “Stat” refer to exponential, transition, and stationary phase, respectively. e Venn diagram of gene presence in the PhoP+SigA regulon and related iModulons. Numbers indicate the amount of genes or non-coding RNAs in each subset. Although the iModulons are significantly enriched for the intersection of the PhoP and SigA regulons, they have been named PhoP-1 and PhoP-2 for simplicity. f, g Bar graphs of PhoP iModulon activity demonstrating the use of PhoP-1 for early biofilm growth (“Colony” refers to individual colonies on a plate after 16 h) and PhoP-2 for extreme phosphate starvation (“Low Phos” indicates phosphate starvation for 3 h).
