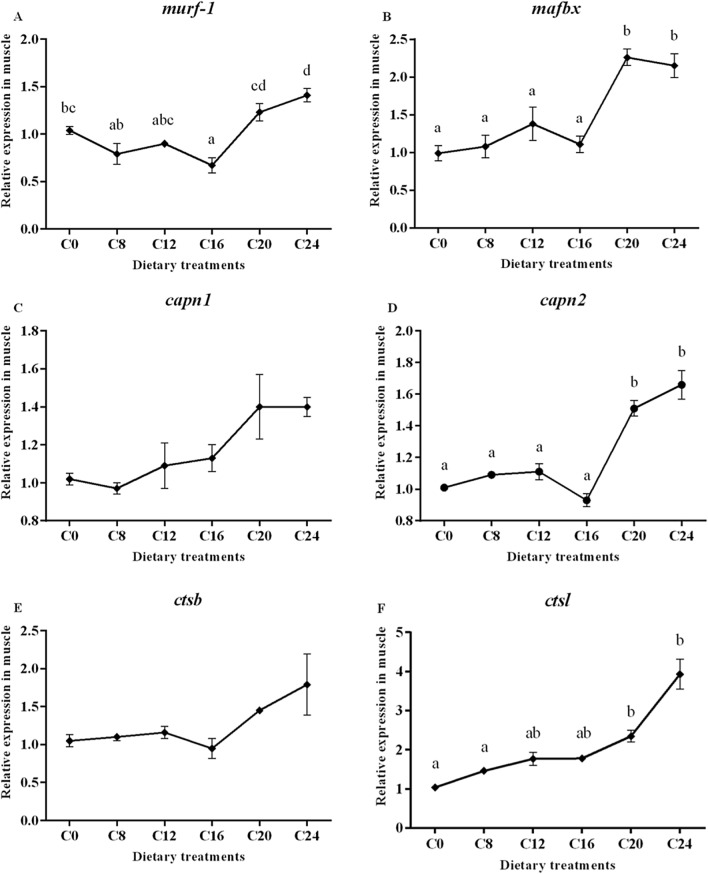
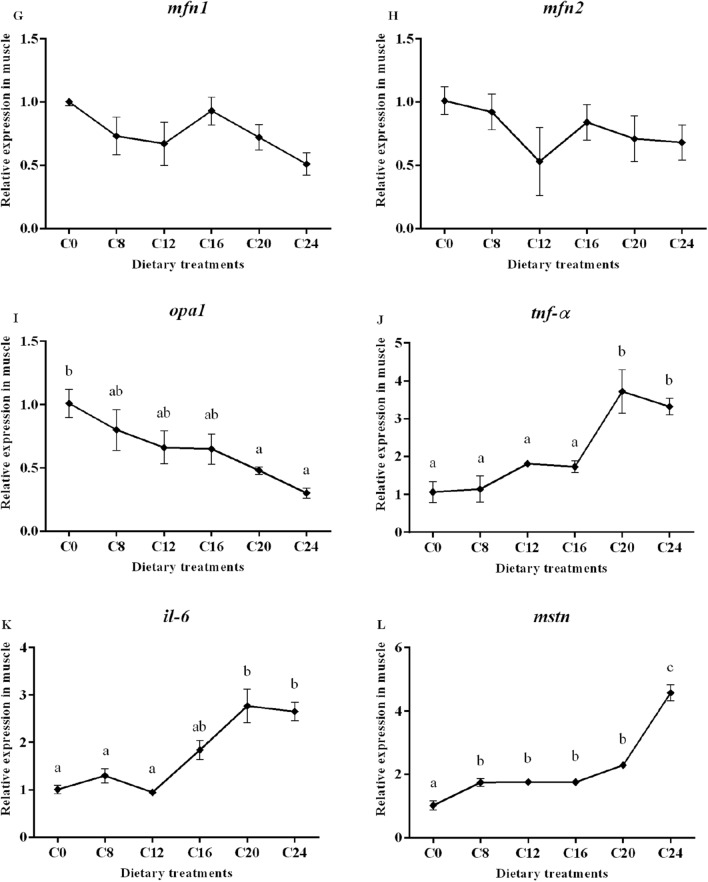
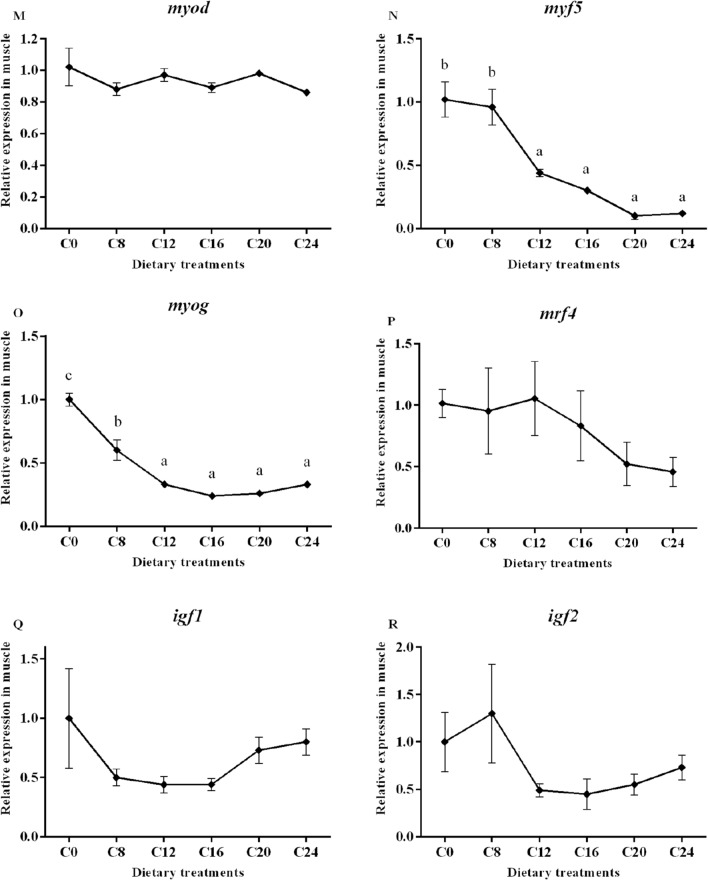
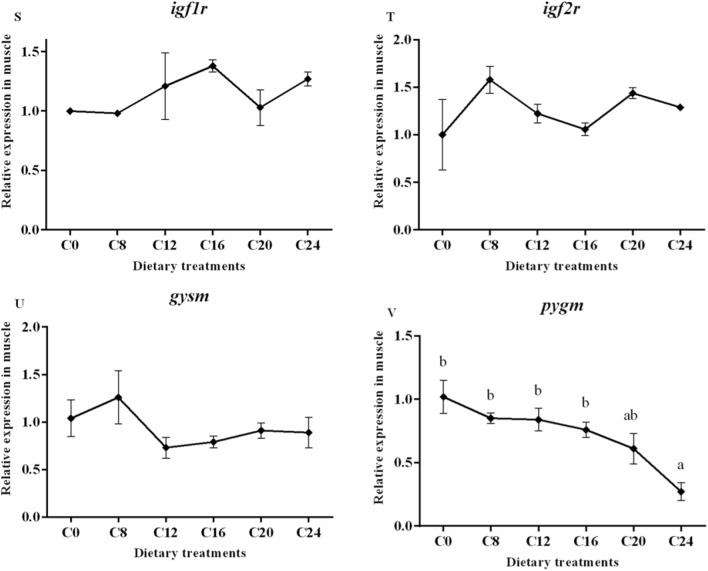
Figure 3.
(1) Expression of genes about protein turnover (murf-1, mafbx, capn1, capn2, ctsb and ctsl), mitochondria membrane infusion (mfn1 and mfn2), cristae organization (opa1), inflammation (tnf-α and il-6), myogenic regulatory factors and mstn (myf5, myod, myog, mrf4 and mstn), insulin-like factors receptors (igf1r and igf2r) and glycogen synthesis and glycogenolysis (gysm and pygm) in the skeletal muscle. Data are shown as mean ± SE. Values with different letters means significant differences (p < 0.05, Tukey’s test).


