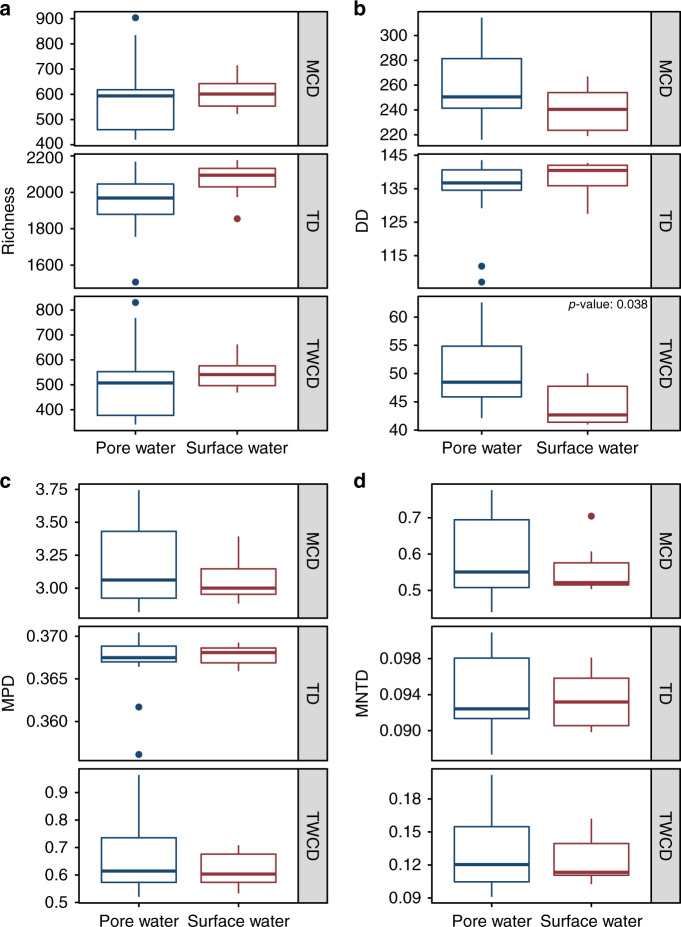
Fig. 2. Alpha diversity boxplots for the metabolite data.
a Richness (akin to metabolite count). b Dendrogram Diversity (DD) which is analogous to Faith’s Phylogenetic Diversity (PD). c Mean Pairwise Distance (MPD). d Mean Nearest Taxon Distance (MNTD). Two-sided Mann–Whitney U tests (Surface water n = 7, Pore water n = 14) determined that only the TWCD-DD comparison was significant; the p value is indicated within the figure. Each panel represents metrics calculated for the corresponding metabolite dendrogram (e.g., MCD, TD, and TWCD). Boxes represent the 1st and 3rd quartiles, the horizontal line within the box represents the median, the vertical lines represent extreme values calculated based on the interquartile range, and the points are potential outliers.

