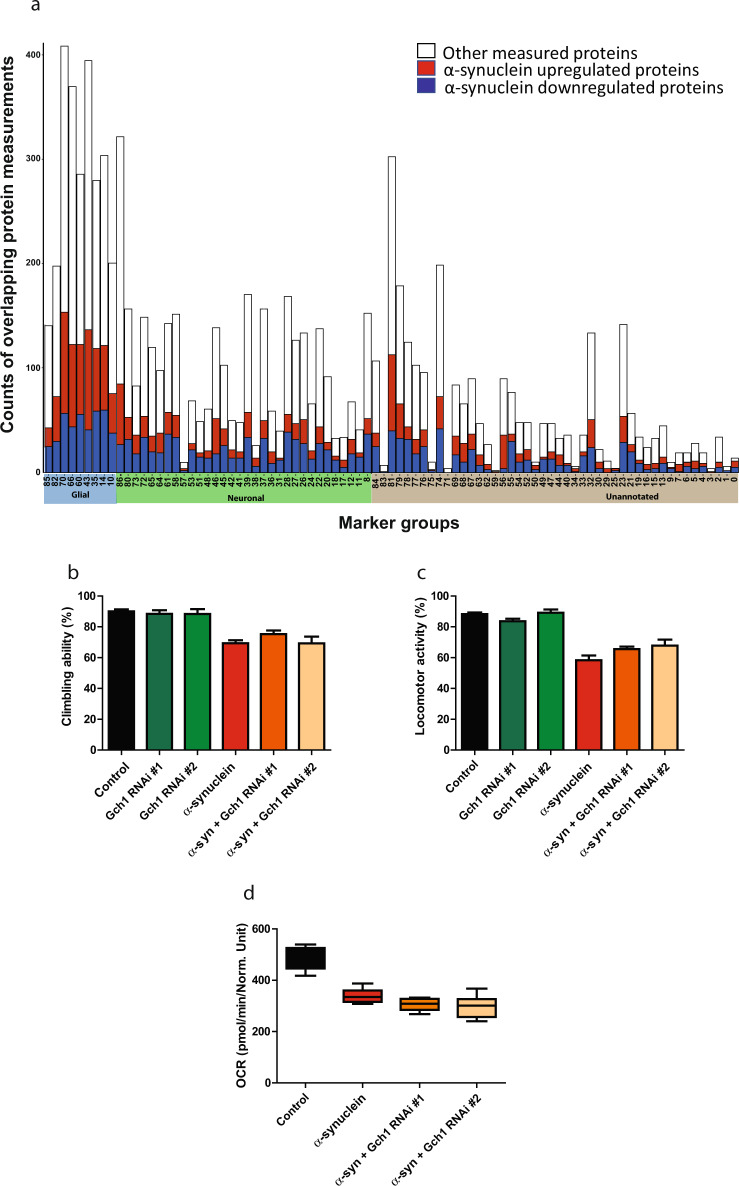
Fig. 6. Cell type specific protein regulation in α-synucleinopathy.
a Cell type distribution of proteins that are differentially expressed when human α-synuclein is expressed in fly neurons. Each bar shows the number of upregulated (red), downregulated (dark blue), and total measured (white) proteins within cell type subgroups. The clusters are separated into three groups: glial (highlighted in light blue on the x-axis), neuronal (highlighted in green on the x-axis), and unannotated (highlighted in gray on the x-axis)42. Glial knockdown of Gch1 does not modify α-synuclein induced (b) climbing deficits, (c) locomotor activity deficits, or (d) basal oxygen consumption rate reduction when compared to flies expressing α-synuclein alone. Control genotype: nSyb-QF2, nSyb-GAL4/+. All data are represented as mean ± SEM. Data are analyzed using one-way ANOVA with Tukey post-hoc test for multiple groups. n = 3–6. Flies are 10 days old.

