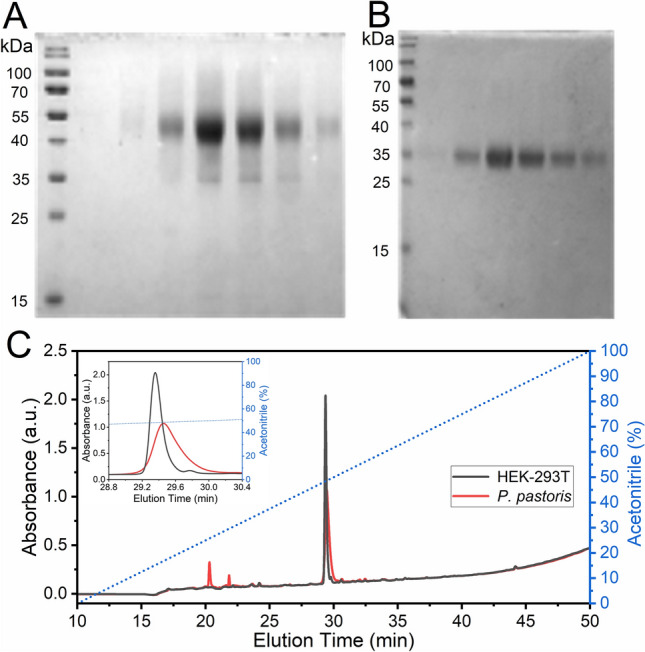
Figure 2.

Analysis by SDS-PAGE and Reverse Phase (RP)-HPLC of RBD produced in P. pastoris or HEK-293T, and purified by NTA-Ni2+. Analysis of recombinant RBD fractions eluted from a NTA-Ni2+ column by 300 mM imidazole after purification from supernatants of a P. pastoris culture (A) or of HEK-293T cells (B). (C) RP-HPLC Analysis of RBD. Profiles for RBD produced in P. pastoris (red) and HEK-293T mammalian cells (black). The inset shows the expanded region of the chromatogram where the highest peaks eluted. The dashed blue line indicates the variation of acetonitrile (% v/v) during the experiments. Peaks 1, 2 and 3 from RBD produced in P. pastoris correspond to areas of 10.1, 2.8 and 87.1%, respectively.
