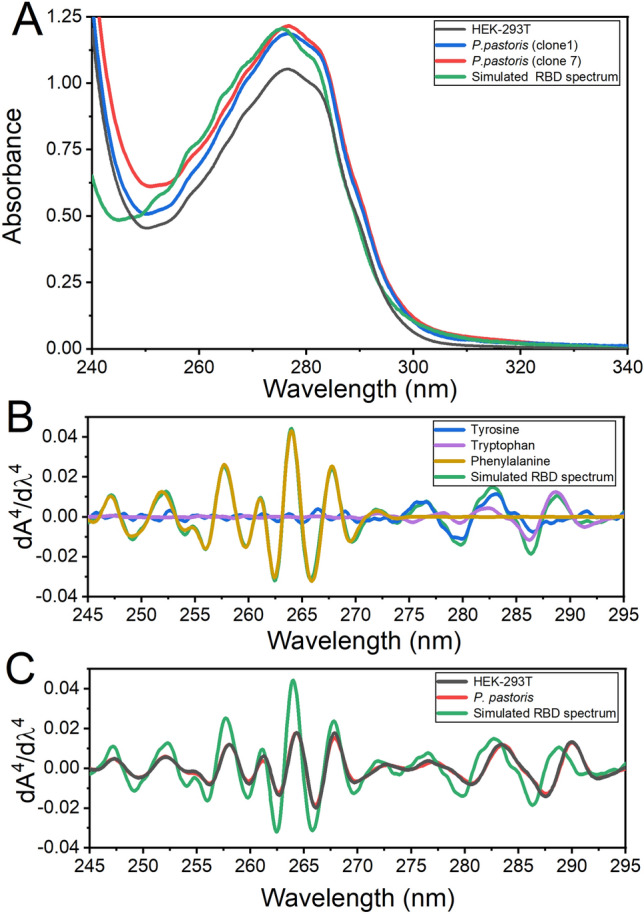
Figure 5.

Absorption spectroscopy. (A) Spectra corresponding to purified RBD produced in HEK-293T cells (black), P. pastoris clones 1 (blue) and 7 (red), and a simulated RBD spectrum (green) (27.5 μM) calculated from its composition of aromatic amino acid (15 Phe, 15 Tyr, and 2 Trp in RBD). (B) Fourth derivative spectra corresponding to the aromatic amino acids (Tyr (blue), Trp (violet), Phe (yellow)) and a simulated RBD spectrum (green). (C) Comparison between the fourth derivative spectra from RBD obtained in HEK-293T (black), P. pastoris RBD Clone 7 (red) and the simulated spectrum presented in A (green).
