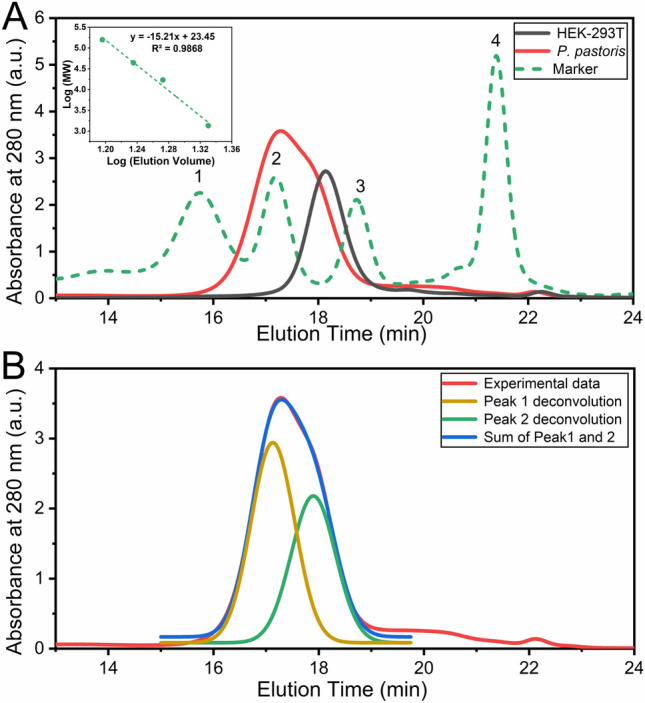
Figure 6.

Hydrodynamic behavior of RBD. (A) SEC-HPLC of RBD produced in P. pastoris (red), HEK-293T (black) and molecular weight markers (dashed green line). This analysis was carried out by injecting 50 μL protein aliquots (0.70 and 0.75 mg/mL for RBD produced in P. pastoris and HEK-293T, respectively) in 20 mM Tris–HCl, 100 mM NaCl, pH 7.0 buffer. The inset shows the correlation between molecular weight and elution volume obtained from the molecular weight markers: (1) gammaglobulin (158 kDa), (2) ovoalbumin (44 kDa), (3) myoglobin (17 kDa), and (4) vitamin B12 (1350 Da). (B) Deconvolution analysis of the chromatographic profile from RBD from P. pastoris. The experimental profile (red), deconvolution of the peak in two different gaussian curves (green and yellow) and the sum of the deconvoluted peaks (blue) are compared.
