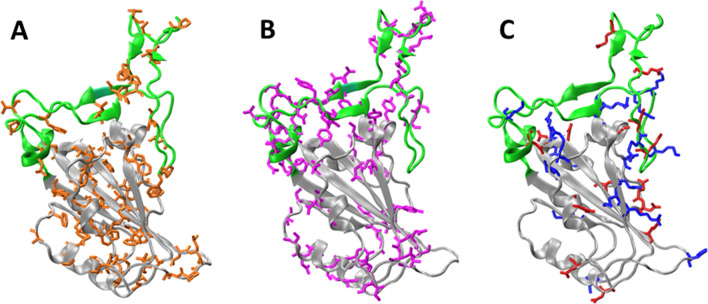
Figure 8.
Subdomains and distribution of residue types on RBD. The Core (gray) and the RBM (green) regions are shown. Panels A, B, and C, shows the non-polar residues (orange: A, C, G, I, L, M, F, P, W and V), polar (violet: N, Q, S, T and Y), and charged residues (blue: basic K, R and H, red: acid D and E), respectively. To build the models we used the chain E of pdb structure 6m0j.

