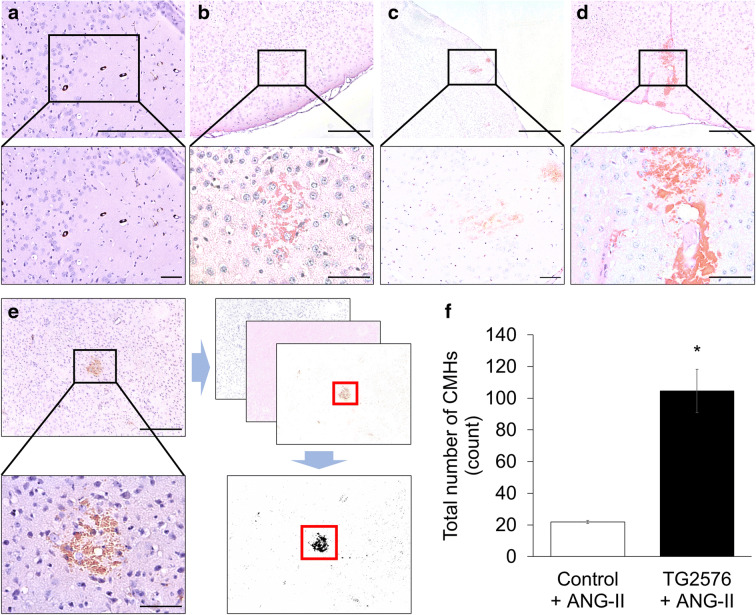
Fig. 1.
Exacerbation of hypertension-induced spontaneous CMHs in TG2576 mice. Representative images of pericapillary (a), diffuse (b), patchy (c), patchy/perivascular (d), and confluent (e) CMHs stained by diaminobenzidine in brains of hypertensive TG2576 mice (scale bar is 200 μm in case of upper panels and for lower panels is 50 μm). Note in d the spread of the hemorrhage to the daughter branches of an arteriole along the perivascular spaces. e Workflow showing analysis of CMHs. Brightfield images of CMHs were captured using a × 4 objective. The images were batch-processed for color deconvolution, thresholding and area measurement. f Total number of hypertension (angiotensin II (Ang II) treatment)-induced CMHs throughout the entire brains of control and TG2576 mice. Data are means ± SEM (n = 6 for each group). *p < 0.0001 vs. wild type

