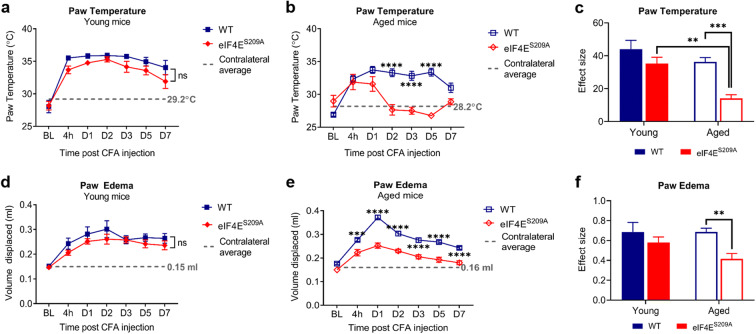
Fig. 2.
Inflammation at the injection site is resolved faster over 7 days in aged eIF4ES209A mice compared with WT. Graphs depicting the paw temperatures recorded by FLIR at indicated times post CFA injection in young (a) and aged (b) mice. Data plotted as means with standard error (young WT, n = 7; young eIF4ES209A, n = 10; aged WT, n = 21; aged eIF4ES209A, n = 8). The dashed gray line indicates the mean temperature of the contralateral paws from all experimental animals on that graph. Two-way repeated measures ANOVA with Sidak’s post hoc was performed. ns, not significant, ****p < 0.0001. c Effect size for all four cohorts. Two-way ANOVA with Tukey’s post hoc test was performed for multiple comparisons between genotypes for young and aged animals. **p 0.0043, ***p 0.0005. Graphs depicting the volume of water displaced from the plethysmometer due to paw edema at indicated times post CFA injection in young (d) and aged (e) mice with effect size for all 4 cohorts (f). The dashed line indicates the mean volume of water displaced by the contralateral paw. Data are plotted and analyzed as stated for parts a, b, and c. For d and e, ns, not significant, ***p 0.0009, ****p < 0.0001. For f, **p 0.0087. BL, baseline; 4 h, four hours; D1, day 1; D2, day 2; D3, day 3; D5, day 5; D7, day 7; CFA, complete Freund’s adjuvant; FLIR, forward-looking infrared

