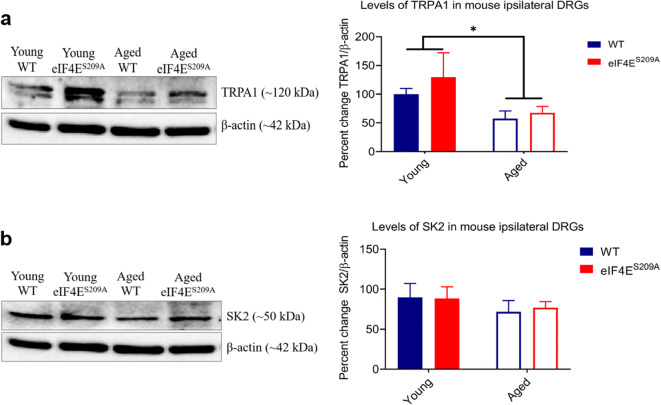
Fig. 7.
Levels of TRPA1 and SK2 in ipsilateral DRG. a Representative western blot for TRPA1 in ipsilateral DRGs and its densitometric analysis. Data are represented as mean and standard error of the mean (young WT, young eIF4ES209A, and aged eIF4ES209A n = 6, aged WT n = 7). A two-way ANOVA was performed followed by Tukey’s post hoc for multiple comparisons. *p = 0.0321 for age effect. b Representative western blot for SK2 in ipsilateral DRGs and its densitometric analysis. Data plotted and analyzed as for a. No significant differences were found

