Fig. 1.
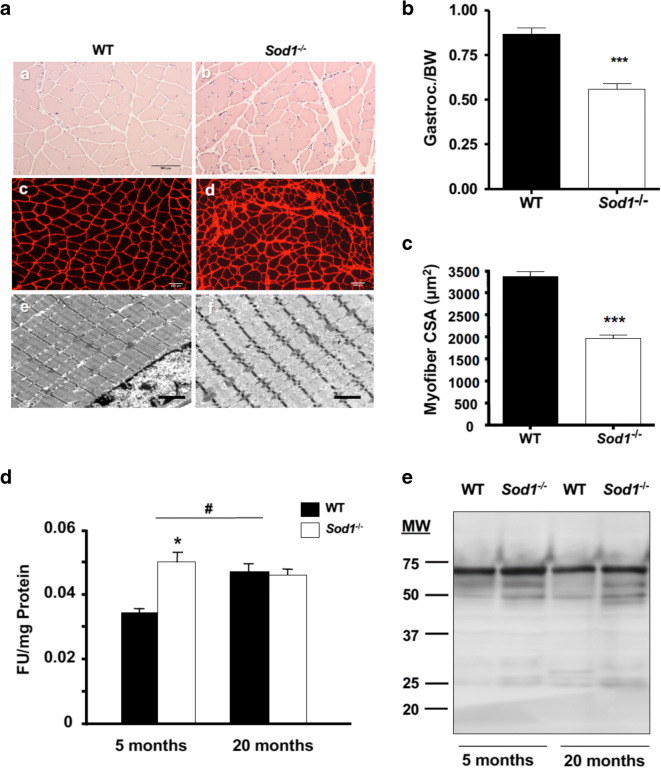
Muscle atrophy in Sod1−/− mice is correlated with protein oxidation. a Morphological and fiber cross-sectional area comparison at 20 months in hematoxylin and eosin (a, b), laminin-stained sections (c, d), and transmission electron micrograph (e, f) of gastrocnemius muscle. Scale bar: 100 μm (in a–d) and 2 μm (in e and f). b Ratio of gastrocnemius wet-weight normalized to body weight. Values were compared using student t test. ***p < 0.001. c Quantification of mean cross-sectional area in a. Values were compared using student t test; ***p < 0.001. d Protein carbonyl levels in cytosolic fraction of WT and Sod1−/− muscle at 5 months and 20 months. Values were compared using two-way ANOVA with Bonferroni post hoc test; *p < 0.05 (WT vs Sod1−/−) and #p < 0.05 (5 months vs 20 months). e A representative Western blot analysis of 3-nitrotyrosin residues from total muscle lysates at 5 months and 20 months

