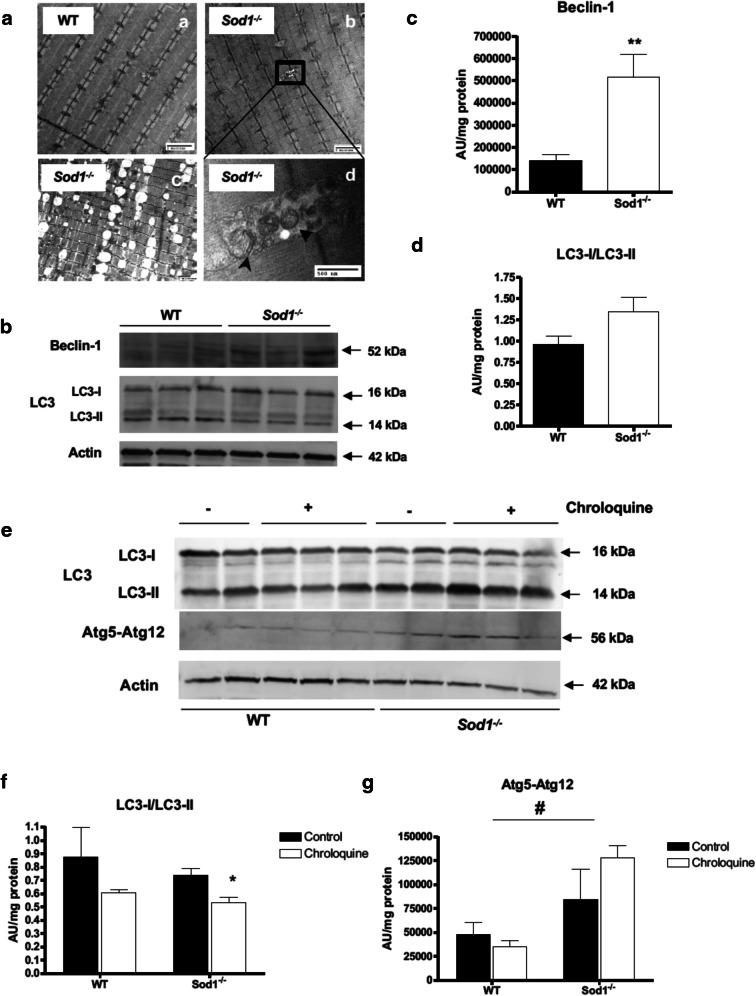
Fig. 4.
Elevated levels of macro-autophagy in muscle of Sod1−/− mice. a Transmission electron microscope (TEM) images of muscle from 15-month-old gastrocnemius muscle from WT (a) and Sod1−/− (b, c, d) mice. Black rectangle represents autophagosome formation in Sod1−/− muscle and higher magnification of shown in (d). Increased accumulation of lysosomal vacuoles shown in (c). Scale bar: 2 μm (in a–c) and 500 nm (in d). b Representative Western blot of autophagic proteins Beclin-1 (top) and LC3-I and II (bottom). c and d A quantification of Western blot analyses shown in (b). Values were compared using student t test; **p < 0.01. e Autophagic flux was measured 24 h after Chloroquine treatment. Autophagosome formation as measurement by ratio between LC3-I and LC3-II (top) and Atg5–12 (bottom). Actin was used as loading control. f and g A quantification of Western blot analyses shown in (d). Values were compared using two-way ANOVA with Bonferroni post hoc test; *p < 0.05 (WT vs Sod1−/−) and #p < 0.05 (5 months vs 20 months)

