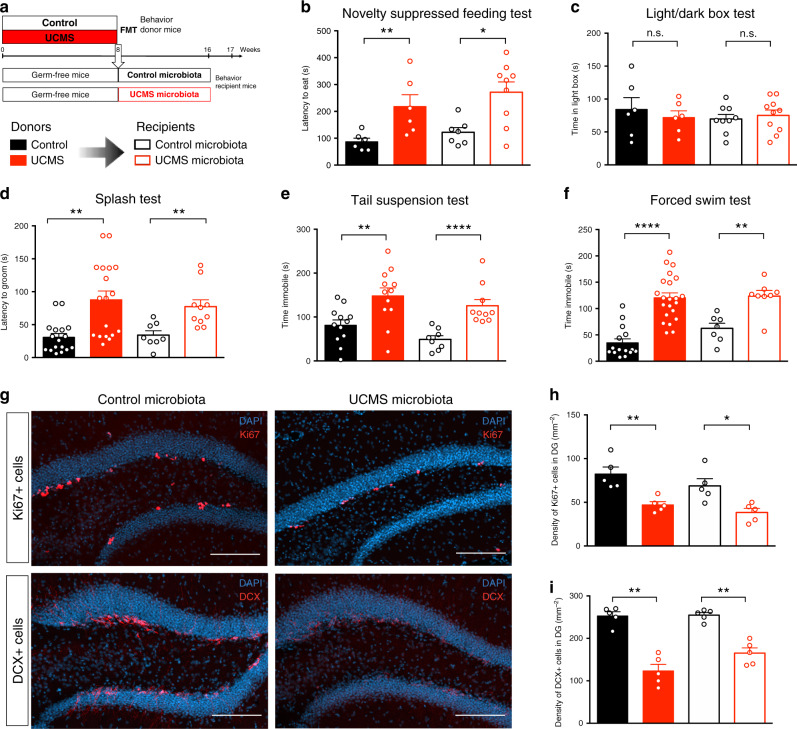
Fig. 1. Microbiota from UCMS mice transfers depressive-like behaviors and reduces adult hippocampal neurogenesis.
a Experimental timeline of fecal microbiota transplantation (FMT) from control and UCMS mice, respectively, “Control microbiota” and “UCMS microbiota,” to germ-free recipient mice. b–f Control mice (black bars), or mice subjected to UCMS (red bars), and mice recipient of the microbiota from Control (open black bars) or UCMS mice (open red bars), underwent different behavioral tests. b Latency to eat in a novel environment in the novelty suppressed feeding test for Control mice (n = 6), UCMS mice (n = 6), Control microbiota-recipient mice (n = 7), and UCMS microbiota-recipient mice (n = 9). (Control vs UCMS, P = 0.0087; Control microbiota- vs UCMS microbiota-recipient mice, P = 0.0229); c Time spent in the light box in the light/dark box test for Control mice (n = 6), UCMS mice (n = 6), Control microbiota-recipient mice (n = 9), and UCMS microbiota-recipient mice (n = 10). (Control vs UCMS, P = 0.6991; Control microbiota- vs UCMS microbiota-recipient mice, P = 0.6038); d Latency to groom in the Splash test for Control mice (n = 17), UCMS mice (n = 18), Control microbiota-recipient mice (n = 8), and UCMS microbiota-recipient mice (n = 10). (Control vs UCMS, P = 0.0004; Control microbiota- vs UCMS microbiota-recipient mice, P = 0.0012); e Time spent immobile in the tail suspension test for Control mice (n = 10), UCMS mice (n = 10), Control microbiota-recipient mice (n = 8), and UCMS microbiota-recipient mice (n = 10). (Control vs UCMS, P = 0.0043; Control microbiota- vs UCMS microbiota-recipient mice, P < 0.0001); f Time spent immobile in the forced swim test for Control mice (n = 15), UCMS mice (n = 22), Control microbiota-recipient mice (n = 7), and UCMS microbiota-recipient mice (n = 8). (Control vs UCMS, P < 0.0001; Control microbiota- vs UCMS microbiota-recipient mice, P = 0.0037). g Representative images of Ki67 staining (top) and DCX staining (bottom) in the DG of the hippocampus, counterstained with DAPI (blue), in Control microbiota-recipient mice (left) and UCMS microbiota-recipient mice (right). h Quantitative evaluation of the density of Ki67+ cells in the dentate gyrus (DG) of the hippocampus for Control mice (n = 5), UCMS mice (n = 5), Control microbiota-recipient mice (n = 5), and UCMS microbiota-recipient mice (n = 5). (Control vs UCMS, P = 0.0079; Control microbiota- vs UCMS microbiota-recipient mice, P = 0.0159). Scale bar: 100 µm. i Quantitative evaluation of the density of DCX+ cells in the DG of the hippocampus for Control mice (n = 5), UCMS mice (n = 5), Control microbiota-recipient mice (n = 5), and UCMS microbiota-recipient mice (n = 5). (Control vs UCMS, P = 0.0079; Control microbiota- vs UCMS microbiota-recipient mice, P = 0.0079). For b–i, data are represented as mean ± s.e.m. Statistical significance was calculated using Mann–Whitney test (*P < 0.05, **P < 0.01, ****P < 0.0001, two tailed). Source data are provided as a Source data file.

