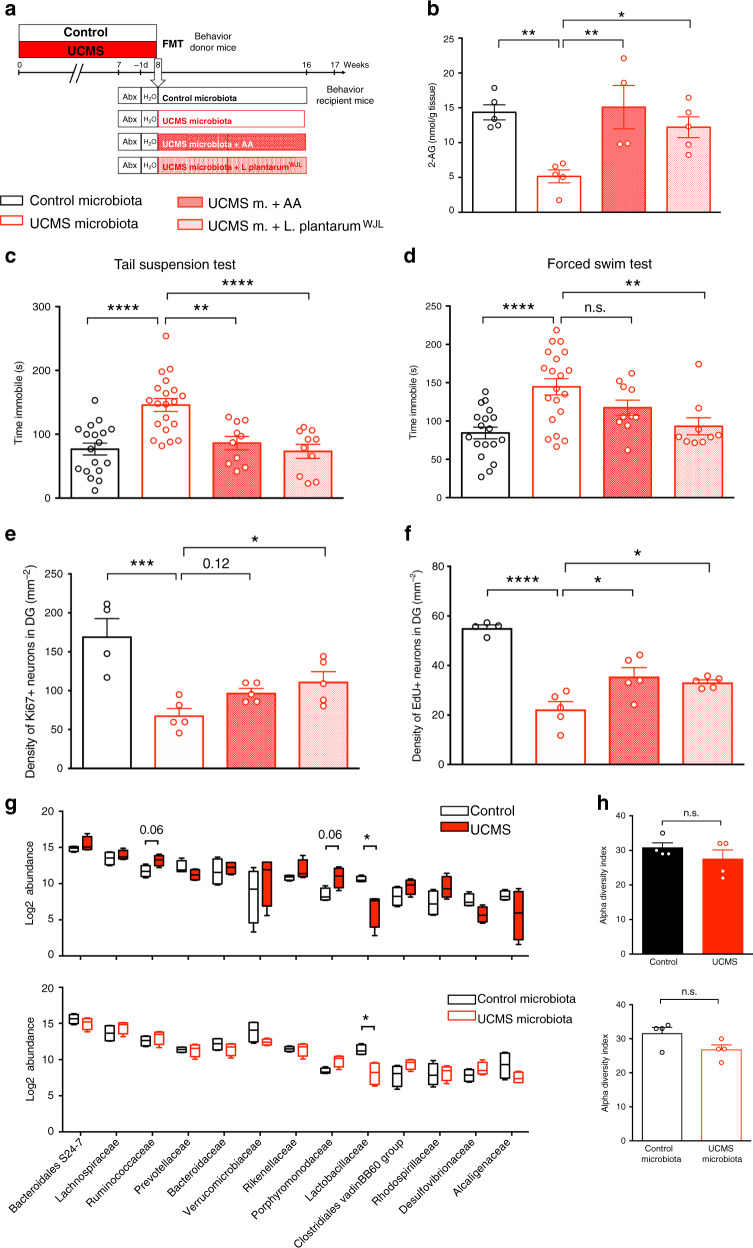
Fig. 5. AA or LpWJL complementation are sufficient to normalize adult neurogenesis and behavior.
a Experimental timeline of arachidonic acid (AA) and L. plantarum treatment in recipient mice. Mice were fed every 2 days through oral gavage with 8 mg of AA/mouse/day. Mice were supplemented by oral feeding 5 days a week with 2 × 10⁸ CFU diluted in 200 μl of PBS. UCMS microbiota-recipient mice were oral fed with PBS as control. b Concentration of 2-AG in the hippocampus for Control microbiota (n = 5), UCMS microbiota (n = 5), UCMS microbiota complemented with AA (n = 4), and UCMS microbiota complemented with LpWJL (n = 5), as determined by targeted LC-MS (Control microbiota- vs UCMS microbiota-recipient mice, P = 0.0062; UCMS microbiota-recipient mice vs UCMS microbiota-recipient mice + AA, P = 0.0053; UCMS microbiota-recipient mice vs UCMS microbiota-recipient mice + LpWJL, P = 0.0371). c Time spent immobile in the tail suspension test for Control microbiota-recipient mice (n = 18), UCMS microbiota-recipient mice (n = 20), UCMS microbiota-recipient mice complemented with AA (n = 10), and UCMS microbiota-recipient mice complemented with LpWJL (n = 10) (Control microbiota- vs UCMS microbiota-recipient mice, P < 0.0001; UCMS microbiota-recipient mice vs UCMS microbiota-recipient mice + AA, P = 0.0015; UCMS microbiota-recipient mice vs UCMS microbiota-recipient mice + LpWJL, P < 0.0001). d Time spent immobile in the forced swim test for Control microbiota-recipient mice (n = 18), UCMS microbiota-recipient mice (n = 20), UCMS microbiota-recipient mice complemented with AA (n = 10), and UCMS microbiota-recipient mice complemented with LpWJL (n = 9) (Control microbiota- vs UCMS microbiota-recipient mice, P < 0.0001; UCMS microbiota-recipient mice vs UCMS microbiota-recipient mice + AA, P = 0.2690; UCMS microbiota-recipient mice vs UCMS microbiota-recipient mice + LpWJL, P = 0.0083). Data are represented as mean ± s.e.m. Statistical significance was calculated using one-way ANOVA with Tukey’s multiple comparisons test (**P < 0.01, ****P < 0.0001). e Quantitative evaluation of the density of Ki67+ cells for Control microbiota-recipient mice (n = 4), UCMS microbiota-recipient mice (n = 5), UCMS microbiota-recipient mice complemented with AA (n = 5), and UCMS microbiota-recipient mice complemented with LpWJL (n = 5) (Control microbiota- vs UCMS microbiota-recipient mice, P = 0.0003; UCMS microbiota-recipient mice vs UCMS microbiota-recipient mice + AA, P = 0.1175; UCMS microbiota-recipient mice vs UCMS microbiota-recipient mice + LpWJL, P = 0.0258). f Quantitative evaluation of the density of EdU+ cells for Control microbiota-recipient mice (n = 4), UCMS microbiota-recipient mice (n = 5), UCMS microbiota-recipient mice complemented with AA (n = 5), UCMS microbiota-recipient mice complemented with LpWJL (n = 5) (Control microbiota- vs UCMS microbiota-recipient mice, P < 0.0001; UCMS microbiota-recipient mice vs UCMS microbiota-recipient mice + AA, P = 0.0113; UCMS microbiota-recipient mice vs UCMS microbiota-recipient mice + LpWJL, P = 0.0394). g 16S rDNA of the fecal microbiota of donor mice at the end of the 8 weeks UCMS protocol (n = 4/group, top) or recipients mice after 8 weeks in isolators (n = 4/group, bottom) was sequenced and analyzed by principal component analysis (PCA) at the level of bacterial families for the relative abundance of bacterial families. Data are represented as boxplots, with median, minima, and maxima. Statistical significance was calculated using Mann–Whitney test (top, Ruminococcaceae, P = 0.0571; Porphyromonadaceae, P = 0.0571; Lactobacillaceae, P = 0.0286; bottom, Lactobacillaceae, P = 0.0286, two tailed). h Alpha diversity for donors (P = 0.6857, top, two tailed) and recipients (P = 0.2286, two tailed). Data are represented as mean ± s.e.m. Statistical significance was calculated using Mann–Whitney test. For b–f, data are represented as mean ± s.e.m. Statistical significance was calculated using one-way ANOVA with Tukey’s multiple comparisons test (*P < 0.05, ***P < 0.0005, ****P < 0.0001). Source data are provided as a Source data file.

