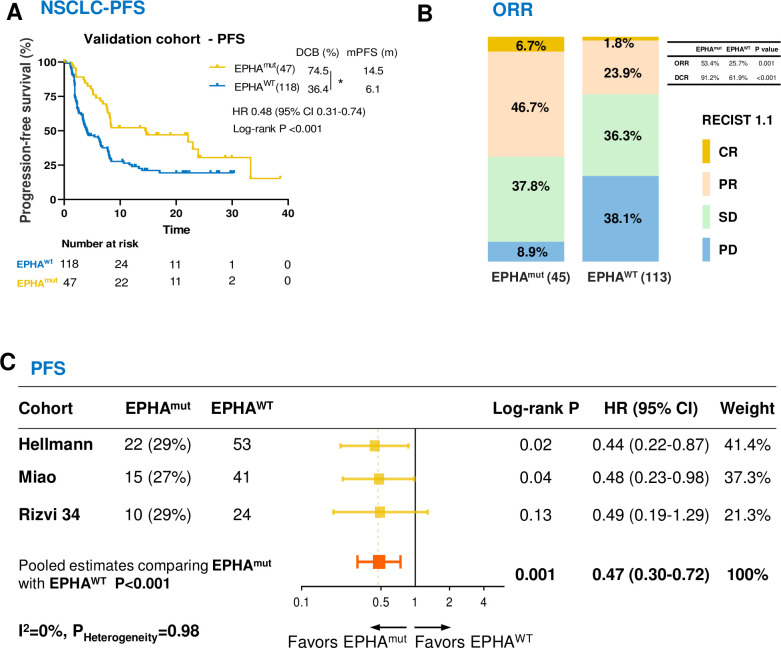
Figure 3.
Association between EPHA mutations and survival in patients with non-small cell lung cancer (NSCLC) treated with immune checkpoint inhibitors in the validation cohort 1. (A) Kaplan-Meier survival curves comparing progression-free survival (PFS) between the EPHAmut group and EPHAwt group in validation cohort. (B) The ratio of patients with complete response (CR), partial response (PR), stable disease (SD) and progression disease (PD) treated with anti-PD-(L)1 antibody in EPHA mutation and EPHA wide-type group. (C) Pooled estimates of PFS. The squares in yellow represent study-specific HRs. The squares in orange indicate the pooled HRs. Horizontal lines indicate the 95% CIs. The p values for heterogeneity and the values of I2 are from the pooled analysis of study-specific HRs. *P<0.05 by Fisher’s exact test.

