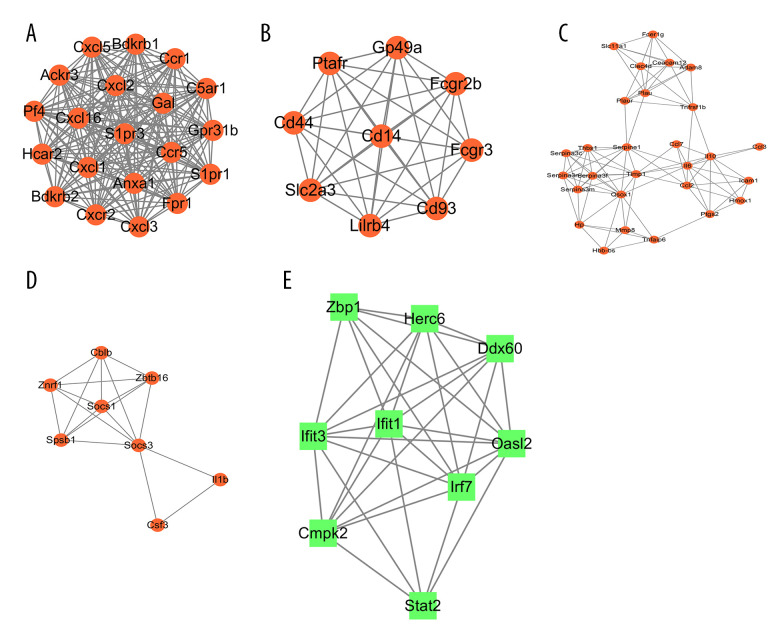
Figure 10.
The modules a (A), b (B), c (C), d (D), and e (E) obtained from the protein–protein interaction (PPI) network. (A–D) The visualized genes of modules in the upregulated differentially expressed genes (DEGs) PPI network. (E) The visualized genes of modules in the downregulated DEGs PPI network.

