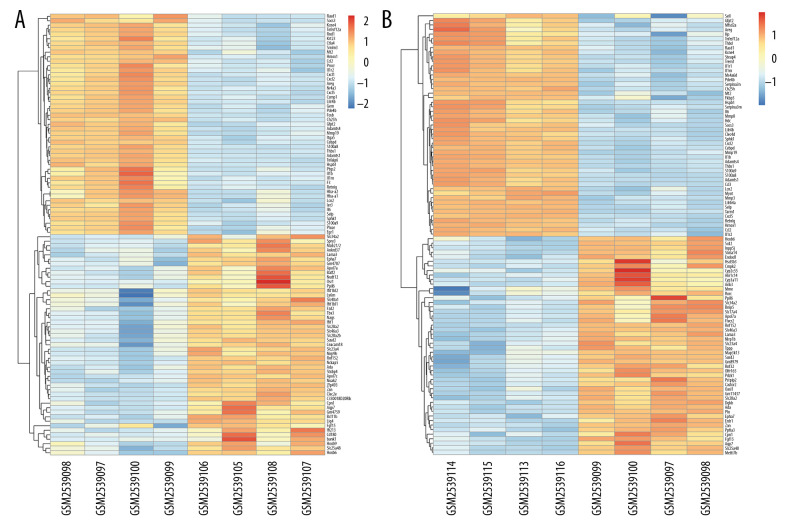
Figure 3.
Hierarchical clustering analysis included DEGs between the sham control and intestinal ischemia/reperfusion (I/R) injury groups. Relative levels of gene expression are represented using a color scale: blue represents downregulated gene levels and red represents upregulated gene levels. (A) 3 h post intestinal I/R injury vs. sham. GSM2539097/2539098/2539099/2539100 refers to the intestine samples from the sham control group, and GSM2539106/2539105/2539108/2539107 refers to the intestine samples from the intestinal I/R group. (B) 6 h post intestinal I/R vs. sham. GSM2539097/2539098/2539099/2539100 refers to the intestine samples from the sham control group, and GSM2539116/2539113/2539115/2539114 refers to the intestine samples from the intestinal I/R group.

