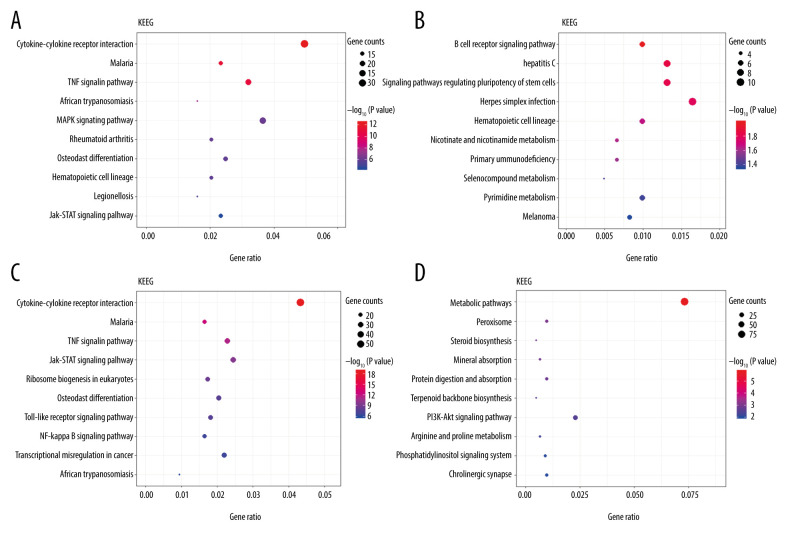
Figure 5.
The Kyoto Encyclopedia of Genes and Genomes (KEGG) pathway analysis of the 10 most significant KEGG enrichment terms. The vertical axis represents enriched KEGG categories, whereas the horizontal axis represents the ratio of enriched genes in the selected category to all genes analyzed in the KEGG enrichment analyses. (A) Dot plot shows the upregulated differentially expressed genes (DEGs) at 3 h post intestinal ischemia/reperfusion (I/R) injury; (B) Dot plot shows the downregulated DEGs at 3 h post intestinal I/R; (C) Dot plot shows the upregulated DEGs at 6 h post intestinal I/R; (D) Dot plot shows the downregulated DEGs at 6 h post intestinal I/R.

