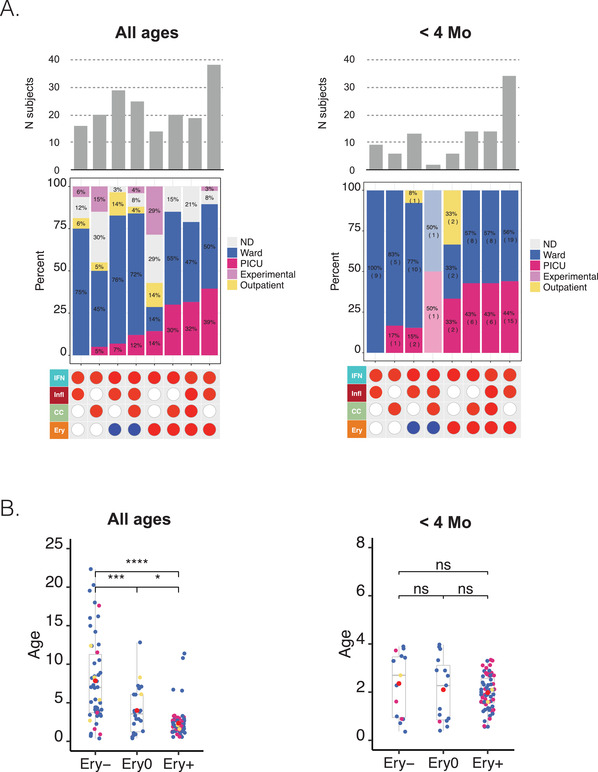
FIGURE 5.

The association of dominant respiratory syncytial virus (RSV) blood transcriptional phenotypes with disease severity as a function of age. A, Bottom panel: The red or blue spots define the status for four traits corresponding to the eight most prevalent RSV phenotypes identified in Figure 4 (>10 subjects). Middle panel: The relative frequency of subjects cared for in the hospital ward, PICU, outpatients, and experimentally exposed subjects. This information was not available for all studies. Top panel: Bar graph showing the number of subjects comprising each of the eight different phenotypes. The combination of tables and graphs on the left is for all subjects. Information for a subset of subjects <4 months is shown on the right. B, The box plots represent the age in months of individuals comprising the consolidated RSV cohort used throughout this study. Patients were categorized according to their Ery trait status. The plot on the right shows the same information but of a subset of patients <4 months. Dots are color‐coded according to severity status (red = PICU, blue = ward, yellow = outpatient). *P < .05, **P < .01, ***P < .001
