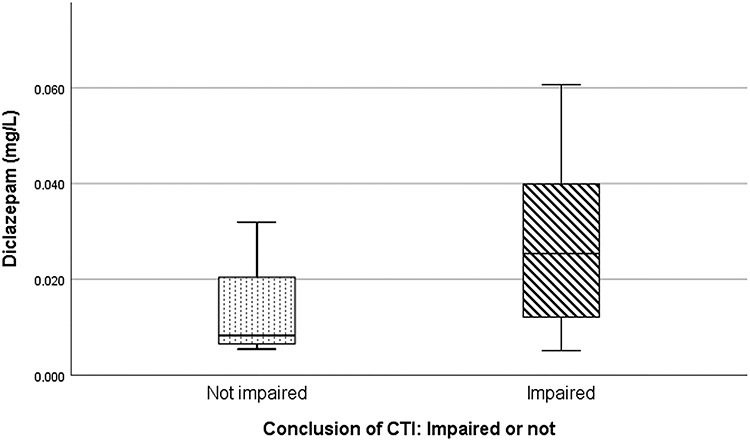
Figure 2.

Concentration of diclazepam in relation to the conclusion of the CTI (‘impaired’ versus ‘not impaired’). The horizontal line in each box represents the median concentration (‘not impaired’ = 0.0083 mg/L, ‘impaired’ = 0.025 mg/L). The box lengths represent the 25–75 percentiles, whereas the whiskers represent the minimum and maximum values.
