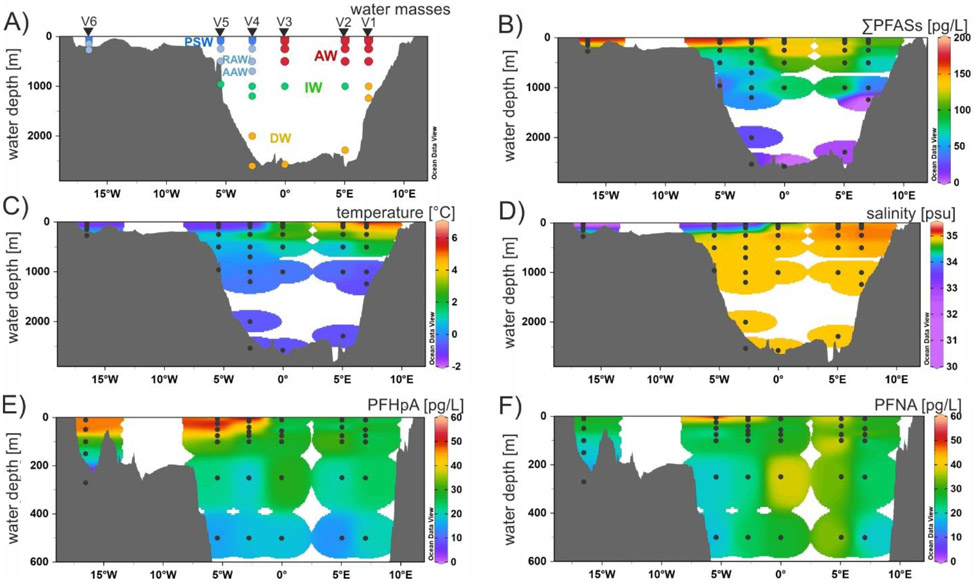
Figure 3:
Distribution of A) water masses, B) sum of PFASs with a detection frequency >50% (C6, C7, C9, C11 PFCAs and PFBS), C) temperature, D) salinity from bottom to surface and E) PFHpA and F) PFNA from 600 m depth to surface along the east-west cross section at ~79°N (depth profiles V1 to V6, cruise stations PS114_12, 9, 25, 43, 46 and 49). Black dots represent samples analyzed for PFASs. Temperature and salinity data was taken from von Appen et al. (2019).48 For bottom bathymetry, GEBCO_2014 gridded data was used. Data were plotted using Ocean Data View.49

