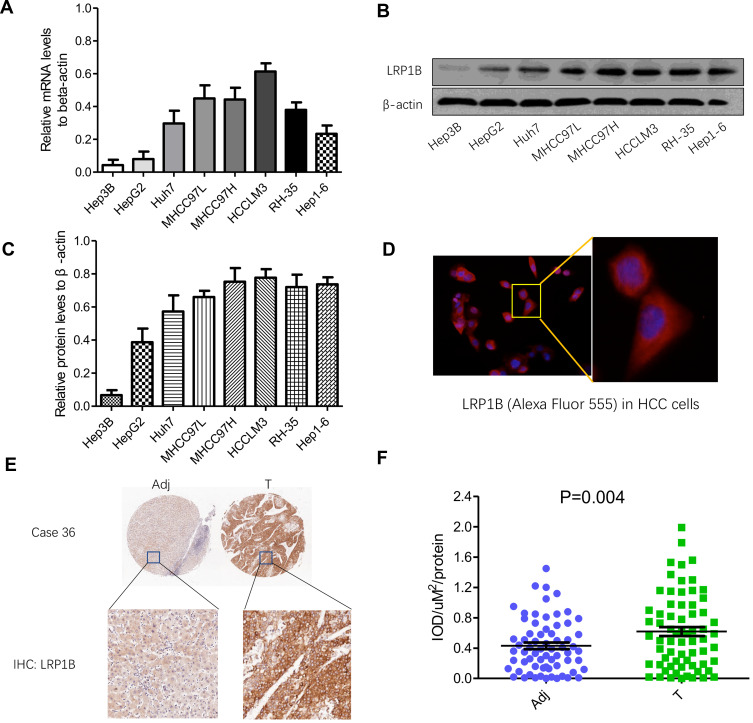
Figure 1.
Expression of LRP1B in HCC cell lines and tissues is different. (A) Relative mRNA levels of LRP1B in different HCC cell lines including Hep3B, HepG2, Huh7, MHCC97L, MHCC97H, HCCLM3, RH-35 and Hep1-6. (B) Expression of LRP1B protein in liver cancer cell lines mentioned above by Western blotting. β-actin was regarded as an internal control. (C) Relative levels of LRP1B protein to β-actin in liver cancer cell lines. (D) Representative images of LRP1B in HCC cells by immunofluorescence staining. Immunofluorescence assay result of HCC cells (from MHCC97H) expressing the primary antibody of LRP1B, followed by Alexa Fluor 555-conjugated secondary antibody (red) is shown. Cell nuclei were counterstained with diamidino phenylindole DAPI (blue). Scale bar = 100 μm, magnification×200 (left). Scale bar = 200 μm, magnification × 400 (right). (E) Representative IHC staining of LRP1B in 80 pairs of HCC tissues (T) and matched adjacent liver tissues (Adj). Immunoreactivity of LRP1B was mainly located in the cytoplasm. (F) Integrated optical density (IOD) for LRP1B staining was obtained. The measurement values represented the mean±standard deviation (SD). Statistical significance was analyzed by two-tailed unpaired Student’s t-test (A, C, F). Triplicate experiments independently with similar results.

