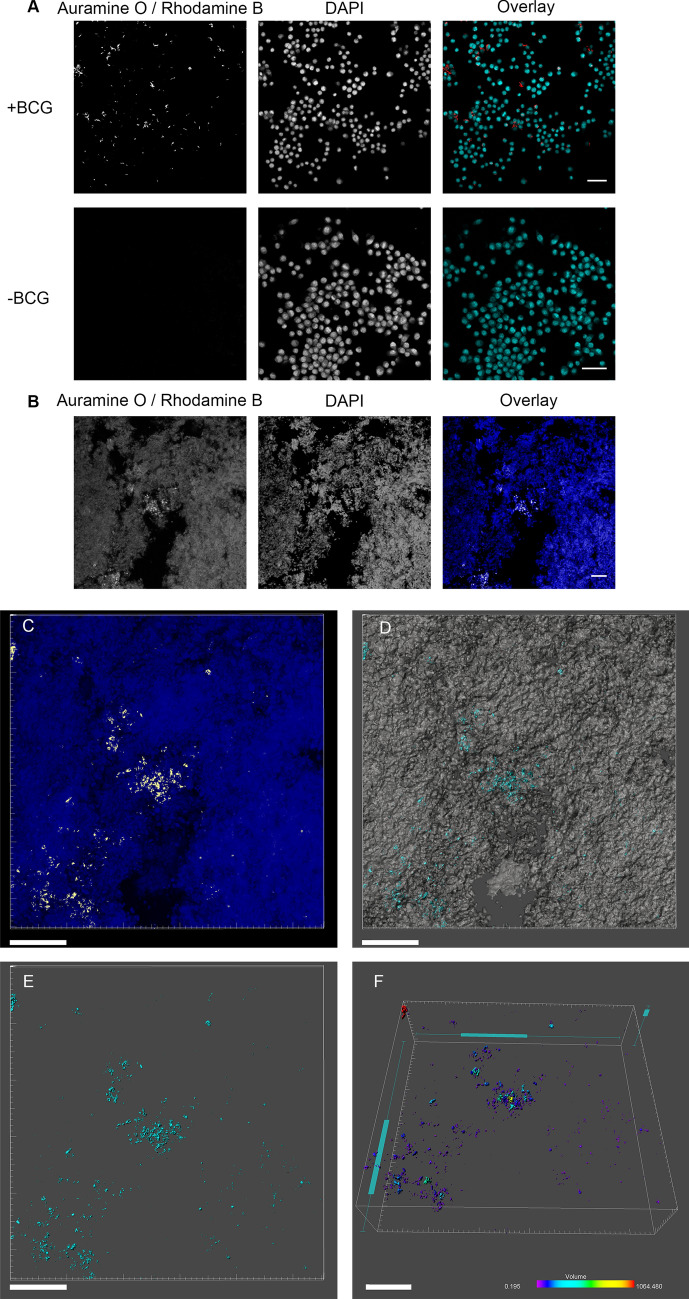
Figure 2.
CUBIC Acid Fast (CAF) staining. CUBIC Acid Fast staining procedure demonstrated in (A) J774 macrophages infected with or without BCG, and (B) in a single CLSM optical section of Mtb infected tissue with a non-thresholded image presented. Multiple thresholded optical sections are then constructed into a Z stack (2 µm step size), with a maximum intensity projection presented (C) with the AurO/RhodB (yellow) and DAPI (blue) signals visible. (D) shows the isosurfaces generated from the AurO/RhodB signal (turquoise) and the DAPI signal (grey), and (E) illustrates just the AurO/RhodB signal which the volumes of the bacterial aggregates can be measured, as demonstrated in (F) with colony volume colour coded (in µm3). Scale bar = 50 µm (A, B) and 100 µm (C–F).

