Figure 7.

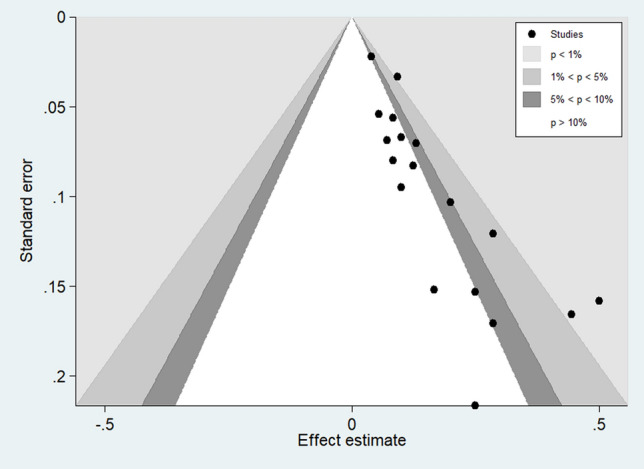
The contour enhanced funnel plot. The contour enhanced funnel plot was estimated using STATA Statistical Software version 15.0 (StataCorp. 2017. Stata Statistical Software: Release 15. College Station, TX: StataCorp LLC).

The contour enhanced funnel plot. The contour enhanced funnel plot was estimated using STATA Statistical Software version 15.0 (StataCorp. 2017. Stata Statistical Software: Release 15. College Station, TX: StataCorp LLC).