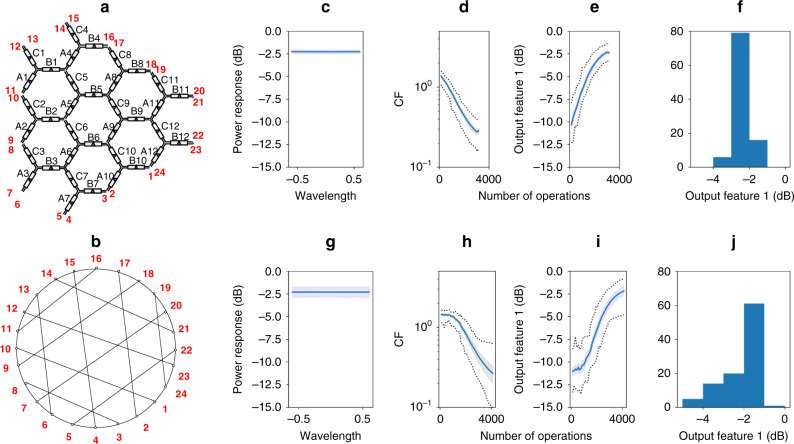
Fig. 3. Numerical results for the self-configuring of an all-cross function in a 36 TB hexagonal waveguide mesh.
Note that the process involves using computational optimization methods and no prior structure testing or calibration is employed. a Labeled schematic of the waveguide mesh arrangement under test with both TBU (black) and port (red) labels. b Black box system with the targeted performance, where the system performs an optical routing between channels defined by the port pairs 12–23, 14–21, 10–1, 8–3, 13–6, 15–4, 17–2, 19–24, and 11–16, 9–18, 7–20, 5–22. Note: they represent direct connections without crossings or splitting. All-cross function statistical results for fixed hyperparameter selection with c–f genetic algorithm and g–j particle swarm optimization for CFall-cross1. From left to right: c, g spectral response versus wavelength normalized to the basic unit delay (BUD)25, d, h evolution of the average (solid), maximum and minimum (dotted), and standard deviation (shaded) cost function, and e, i output feature(OF) and f, j histogram of the last operation (OF1: average of normalized output channels power of the beamsplitters, the datasheet is composed of 100 independent experiments with different arbitrary waveguide mesh initial conditions.

