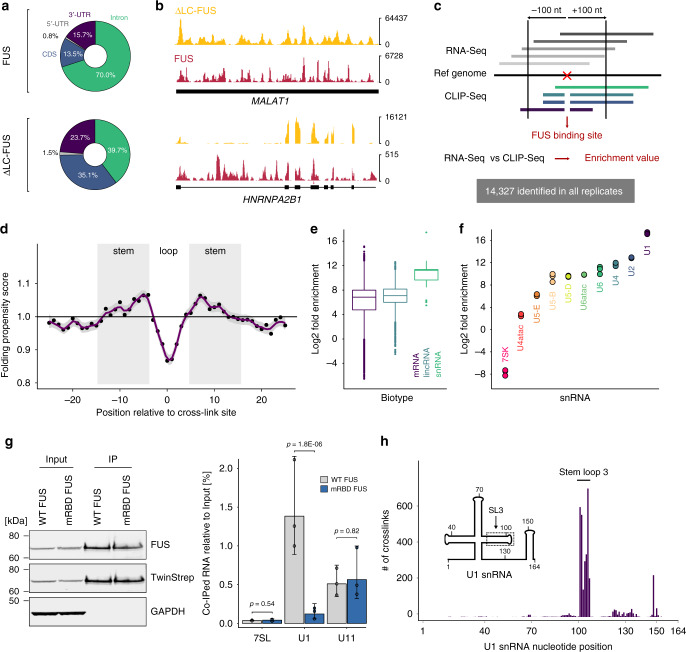
Fig. 2. CLIP-Seq reveals U1 snRNA as a major FUS target.
a Read distribution of FUS and ΔLC-FUS CLIP experiments in pre-mRNAs according to the annotated transcript region. b Genome browser views showing the distribution of FUS and ΔLC-FUS CLIP reads on selected genes. c Schematic representation of the analysis approach used to infer FUS-binding sites from CLIP data. d Folding propensity of nucleotides proximal to cross-link sites identified in all biological replicates. The error band depicts the standard error of the local regression curve. n = 3. e Box plot showing the distribution of enrichment values for binding sites located in distinct transcript biotypes. The plot displays median lines, interquartile range (IQR) boxes, 1.5 × IQR whiskers and remaining data points. n = 4929 (lincRNA), 115,104 (mRNA), 125 (snRNA), examined in three biological replicates. f Dot plot showing the mean enrichment value inferred from all binding sites of individual snRNAs (corresponding to panel e) for three biological replicates. g WT and RNA-binding-deficient FUS was purified from HeLa cells and detected by western blotting using anti-FUS and anti-Twin-Strep antibodies. GAPDH served as a loading control. Extracts corresponding to 2 × 10⁵ cell equivalents were loaded as input, IP fractions correspond to 2 × 10⁶ cell equivalents. RNA levels were assessed by RT-qPCR and quantified relative to the input. Mean values and standard deviations of three biological replicates are shown. P values were computed from log-transformed values using two-sided unequal variance Welch’s t test. n = 3. h Bar plot displaying the number of cross-links for every nucleotide along the U1 snRNA primary sequence.

