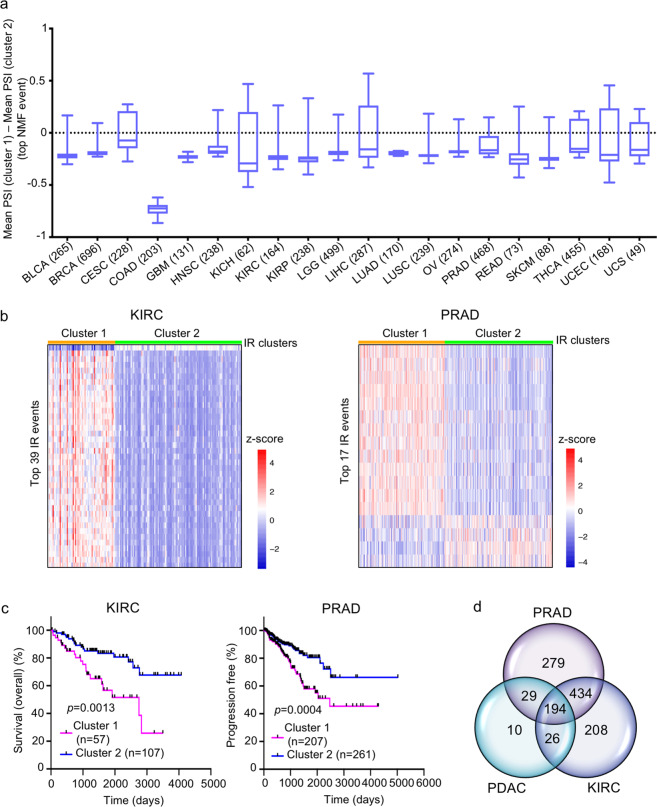
Fig. 6. Clustering of patients of different cancer types based on IR events.
a Box plots for the mean PSI value difference for top NMF events between the two IR-based clusters of different cancer types. The number in parenthesis indicates the number of patients for that cancer type. b Heatmaps comparing the IR levels of top NMF events between the two clusters of KIRC and PRAD cancer types. z-scores (calculated using the PSI values) are represented by red and blue colors indicating high and low IR levels, respectively. c OS and PFI plots comparing the two clusters of KIRC and PRAD, respectively. p values were determined by log-rank (Mantel−Cox) test; n number of patients (tumors). d Venn diagram showing the overlap between the three groups of RBP genes that significantly change in expression between the two clusters of PDAC, PRAD, and KIRC, respectively.

