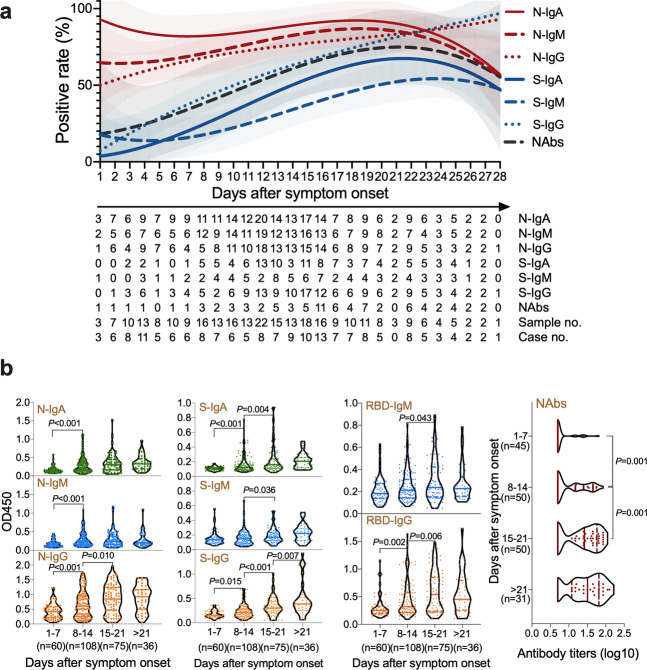
Fig. 1. The characteristics of humoral responses in COVID-19.
a The positive rate of IgA, IgM, and IgG antibodies against SARS-CoV-2 nucleocapsid (N), spike (S) proteins and neutralizing antibodies (NAbs) in all the cases between 1 and 28 days after symptom onset. The fitted curve lines are created by Fit Spline program of Graphpad software where shadows indicating 95% confidence intervals. The table below the figure denotes the number of samples tested at each time point given in days and the positive rate at each day were used to draw the fitted curve. b Levels of IgM, IgA, and IgG antibodies and titers of NAbs against SARS-CoV-2 in plasma samples over course of the disease. Antibody titers were expressed as optical density (OD) value and NAbs titers are shown as geometric mean titers (GMTs). The median and quartiles were represented in the violin plots.

