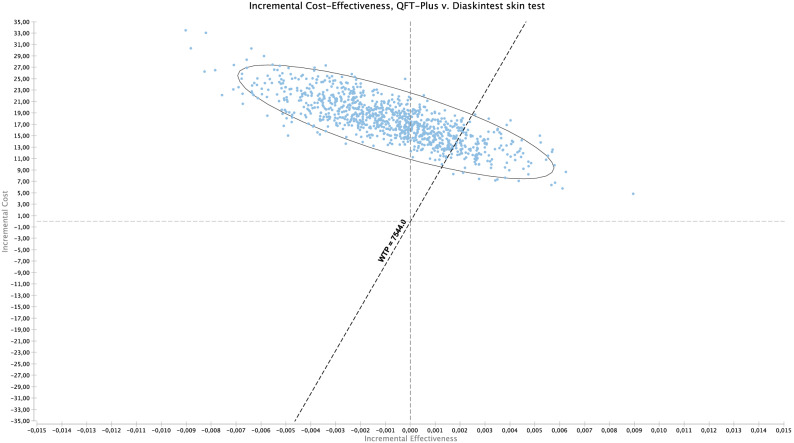
Figure 4.
Scatter plot of QFT-Plus versus Diaskintest incremental cost-effectiveness ratio (ICER) in costs (in 2020 US dollars [US$]) per quality-adjusted life years (QALYs). This scatter plot shows 10,000 Monte Carlo iterations results of ICER of QFT-Plus versus Diaskintest. The diagonal line represents the willingness to pay threshold of US $7544. The elliptical line represents the 95% confidence interval. Values on the left upper quadrant are dominated. Values on the right upper quadrant are most costly and more effective. Values to the left of the diagonal line are above the willingness to pay threshold value. QFT-Plus QuantiFERON TB Gold Plus.

