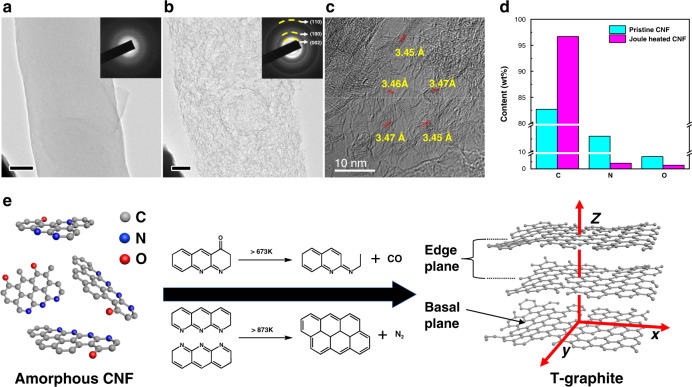
Fig. 3. TEM and EDS analyses of pristine amorphous CNF evolution during Joule heating.
a TEM image of original CNF without salt loading is shown. The corresponding SAED pattern displays diffusive rings, which is a characteristic of an amorphous structure. Scale bar is 50 nm. b TEM image of wrinkled CNF achieved after Joule heating, where the SAED pattern shows sharp rings, corresponding to T-graphite. Scale bar is 50 nm. c HRTEM image of the wrinkled structure and d quantitative EDS analysis of carbon, nitrogen and oxygen content in a CNF before and after Joule heating. e Amorphous CNF evolution during Joule heating and typical routes of N and O removal at high temperature.

