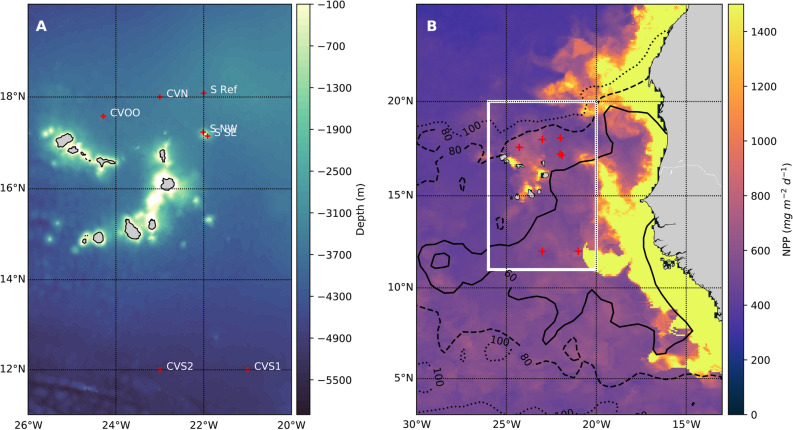
Figure 1.
The eastern tropical North Atlantic (A). Zoomed-in working area, as in the white box from (B), around Cape Verde with coded stations indicated (color scale indicates GEBCO bathymetry). CVOO Cape Verde Ocean Observatory, CVN Cape Verde North, S Ref Senghor Reference, S NW Senghor North West, SSE Senghor South East, CVS1 Cape Verde South 1, CVS2, Cape Verde South 2. (B). with color scale indicating satellite-derived net primary productivity (NPP) during cruise MSM49 (estimated according to51 and obtained from http://sites.science.oregonstate.edu/ocean.productivity), black contours indicating 60, 80 and 100 µmol kg−1 oxygen at 400 m depth (World Ocean Atlas 2018). Red crosses indicate working stations. Maps were produced using python (packages: matplotlib and basemap).

