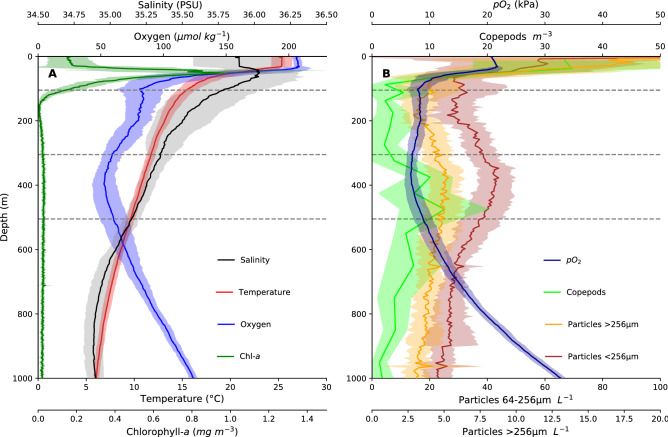
Figure 2.
Hydrographic profiles of the sampled stations during MSM49 with mean (± SD) vertical distribution of chlorophyll-a (green), temperature (red) and oxygen (blue) from the CTD (left) as well as oxygen partial pressure, particle abundance (64–256 µm and > 256 µm) and copepod abundance (right). Dashed grey lines indicate four depth strata defined based upon mean hydrographic conditions (upper layer UL, upper oxycline UOC, oxygen minimum zone OMZ and lower oxycline LOC).

