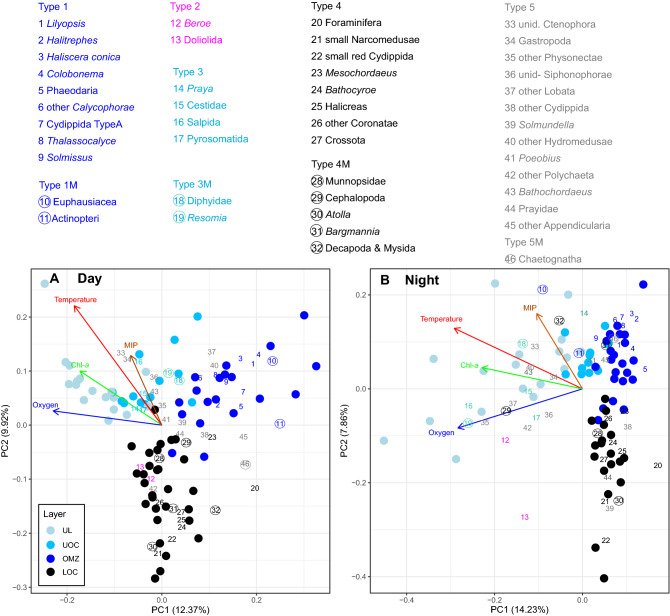
Figure 5.
Principal component analysis of the daytime (A) and nighttime (B) community composition (46 taxa, see Table S2). Circles are samples, with the color indicating the four nominal depth layers. One sample is a discrete observation (one transect at a given station). Taxa are represented by numbers, color coded by the identified distribution type 1 (in OMZ, blue), 2 (bimodal, magenta), 3 (above OMZ, cyan), 4 (below OMZ, black) and 5 (no clear pattern, grey). Numbers in circles identify taxa with diel vertical migration (M). The mid-point of the taxon numbers is the PC1/PC2 score location. Vectors are only drawn for environmental variables (oxygen, temperature, chlorophyll-a, and particles). The layer abbreviations refer to: upper layer (UL), upper oxycline (UOC), oxygen minimum zone (OMZ), and lower oxycline (LOC).

