
Fig. 1. Box-whisker plots comparing the alpha diversity of the inoculum aliquots among the different donors using the Shannon index.
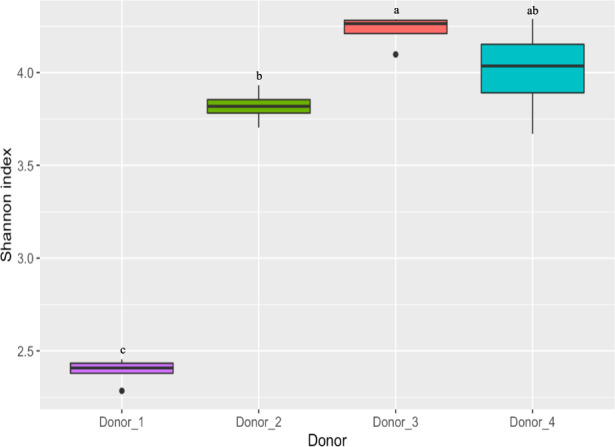
Statistical comparisons were performed using the Wilcoxon rank-sum test. Boxes with different letters indicate statistically significant differences (p < 0.05). The box represents the 25th and 75th percentiles as the interquartile range (IQR) and the short black line represents the median. The whiskers represent the minimum and maximum values. Outliers are shown as black dots. n = 3 inoculum aliquots for Donor_1 and n = 4 inoculum aliquots or Donor_2, Donor_3, and Donor_4.