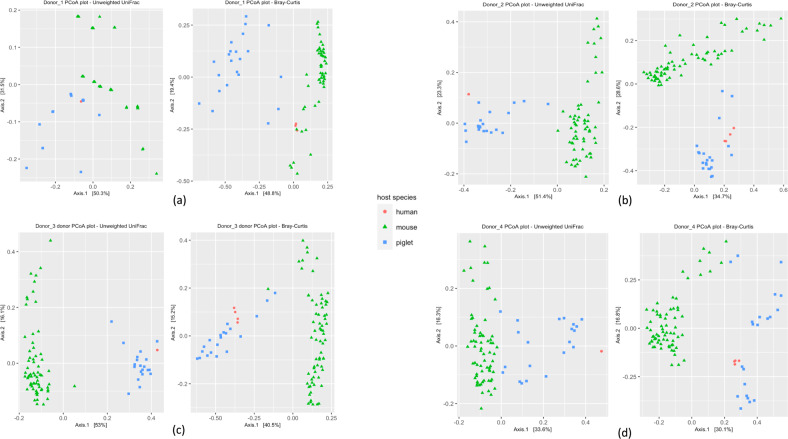
Fig. 2. Principal Coordinate Analysis (PCoA) plots using unweighted UniFrac and Bray-Curtis distances for the bacterial communities in each of the four donor inocula and the fecal samples from the corresponding HMA animal models.
(a) Donor_1, (b) Donor_2, (c) Donor_3, (d) Donor_4. n = 13 (3 piglets/donor, with the exception n = 4 for Donor_1, 2 days post inoculation) and n = 37 mice (Donor_1 = 7, Donor_2 = 10, Donor_3 = 10, Donor_4 = 10). Red circles, human donor inocula; green triangles, HMA mouse fecal samples; blue squares, HMA piglet fecal samples.

