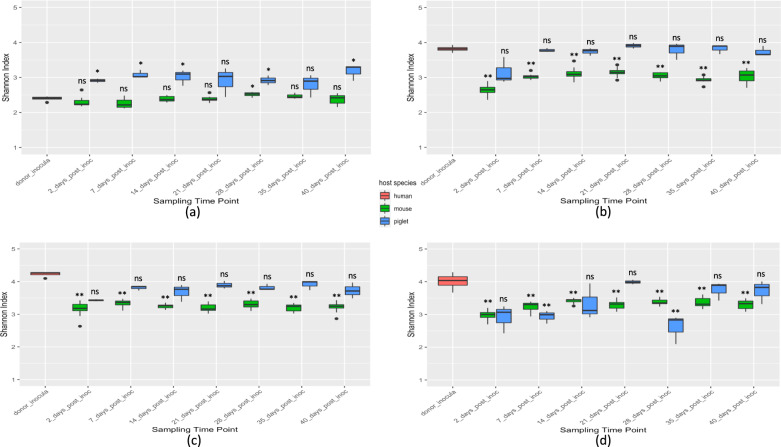
Fig. 4. Box-whisker plots depicting the variation in alpha diversity between the donor inocula and the HMA animal fecal samples at each sampling time point.
(a) Donor_1, (b) Donor_2, (c) Donor_3, and (d) Donor_4. The box represents the 25th and 75th percentiles as the interquartile range (IQR) and the short black line represents the median. The whiskers represent the minimum and maximum values. Outliers are shown as black dots. Statistical comparisons are based on the Wilcoxon rank-sum test. *p < 0.05; **p < 0.01; ns–not significant. n = 13 (3 piglets/donor, with the exception n = 4 for Donor_1, 2 days post inoculation) and n = 37 mice (Donor_1 = 7, Donor_2 = 10, Donor_3 = 10, Donor_4 = 10).

