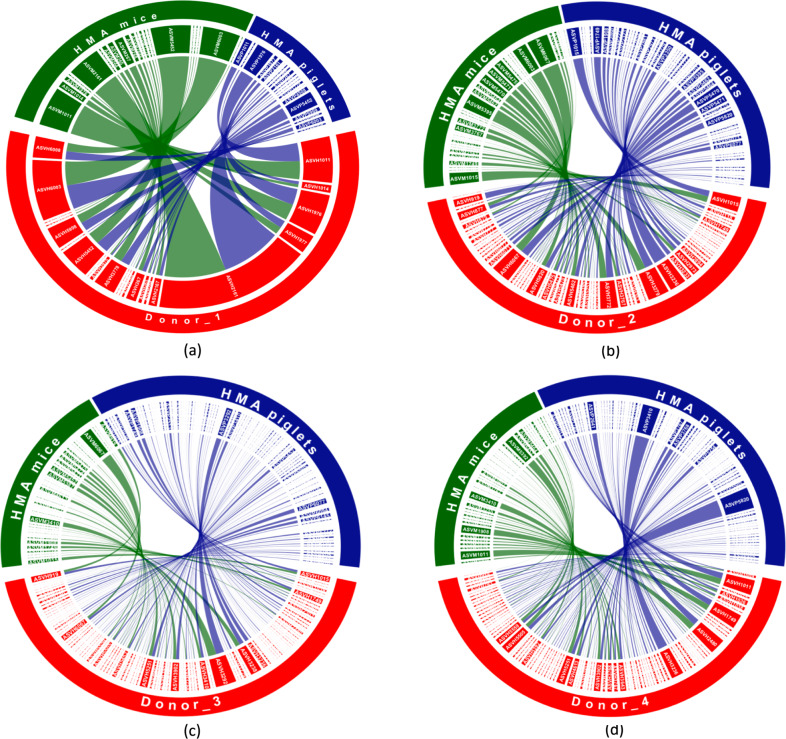
Fig. 5. Chord diagram representing the colonization patterns of core donor ASVs in the two HMA animal models.
(a) Donor_1, (b) Donor_2, (c) Donor_3, (d) Donor_4. Each sector represents an ASV and the size of the sector corresponds to the mean relative abundance of that ASV in the host species. Links indicate which core donor ASVs established in each animal model and the widths at each end of a link are proportional to the abundance of that ASV in the respective host species. Core donor ASVs which failed to colonize both HMA animal models are not shown. ASVs have been designated according to the following example: ASV_1 is ASVH1 in human donors, ASVM1 in HMA mice, and ASVP1 in HMA piglets. n = 13 (3 piglets/donor, with the exception n = 4 for Donor_1, 2 days post inoculation) and n = 37 mice (Donor_1 = 7, Donor_2 = 10, Donor_3 = 10, Donor_4 = 10).

