Figure 5.
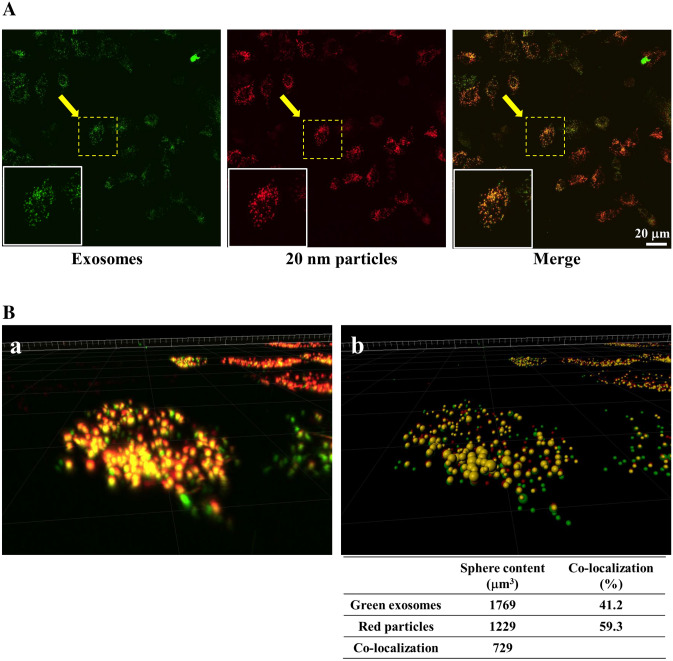
Localization of green fluorescent exosomes or 20-nm red fluorescent nanoparticles in CHO-MARCO cells. (A: CHO-MARCO cells were cultured with both green fluorescent exosomes and 20-nm red fluorescent nanoparticles for 6 h. The localization of exosomes and nanoparticles were observed using confocal super-resolution microscopy. (B) Images collected from the multiple Z-stacks were imported into the Imaris platform. The 3D image example of the region (surrounded by the dashed line) observed from the arrow in (A) is shown. (a) Image in 3D-renderings of raw data. (b) 3D visualization of the image using Imaris. For quantification of co-localized area, the individual sphere content of the 3D image was analyzed by Imaris using two channels, green and red. The percentage (%) was calculated as co-localized sphere content/each sphere content. The sphere volumes (µm3) and percentages are shown below the figure.

