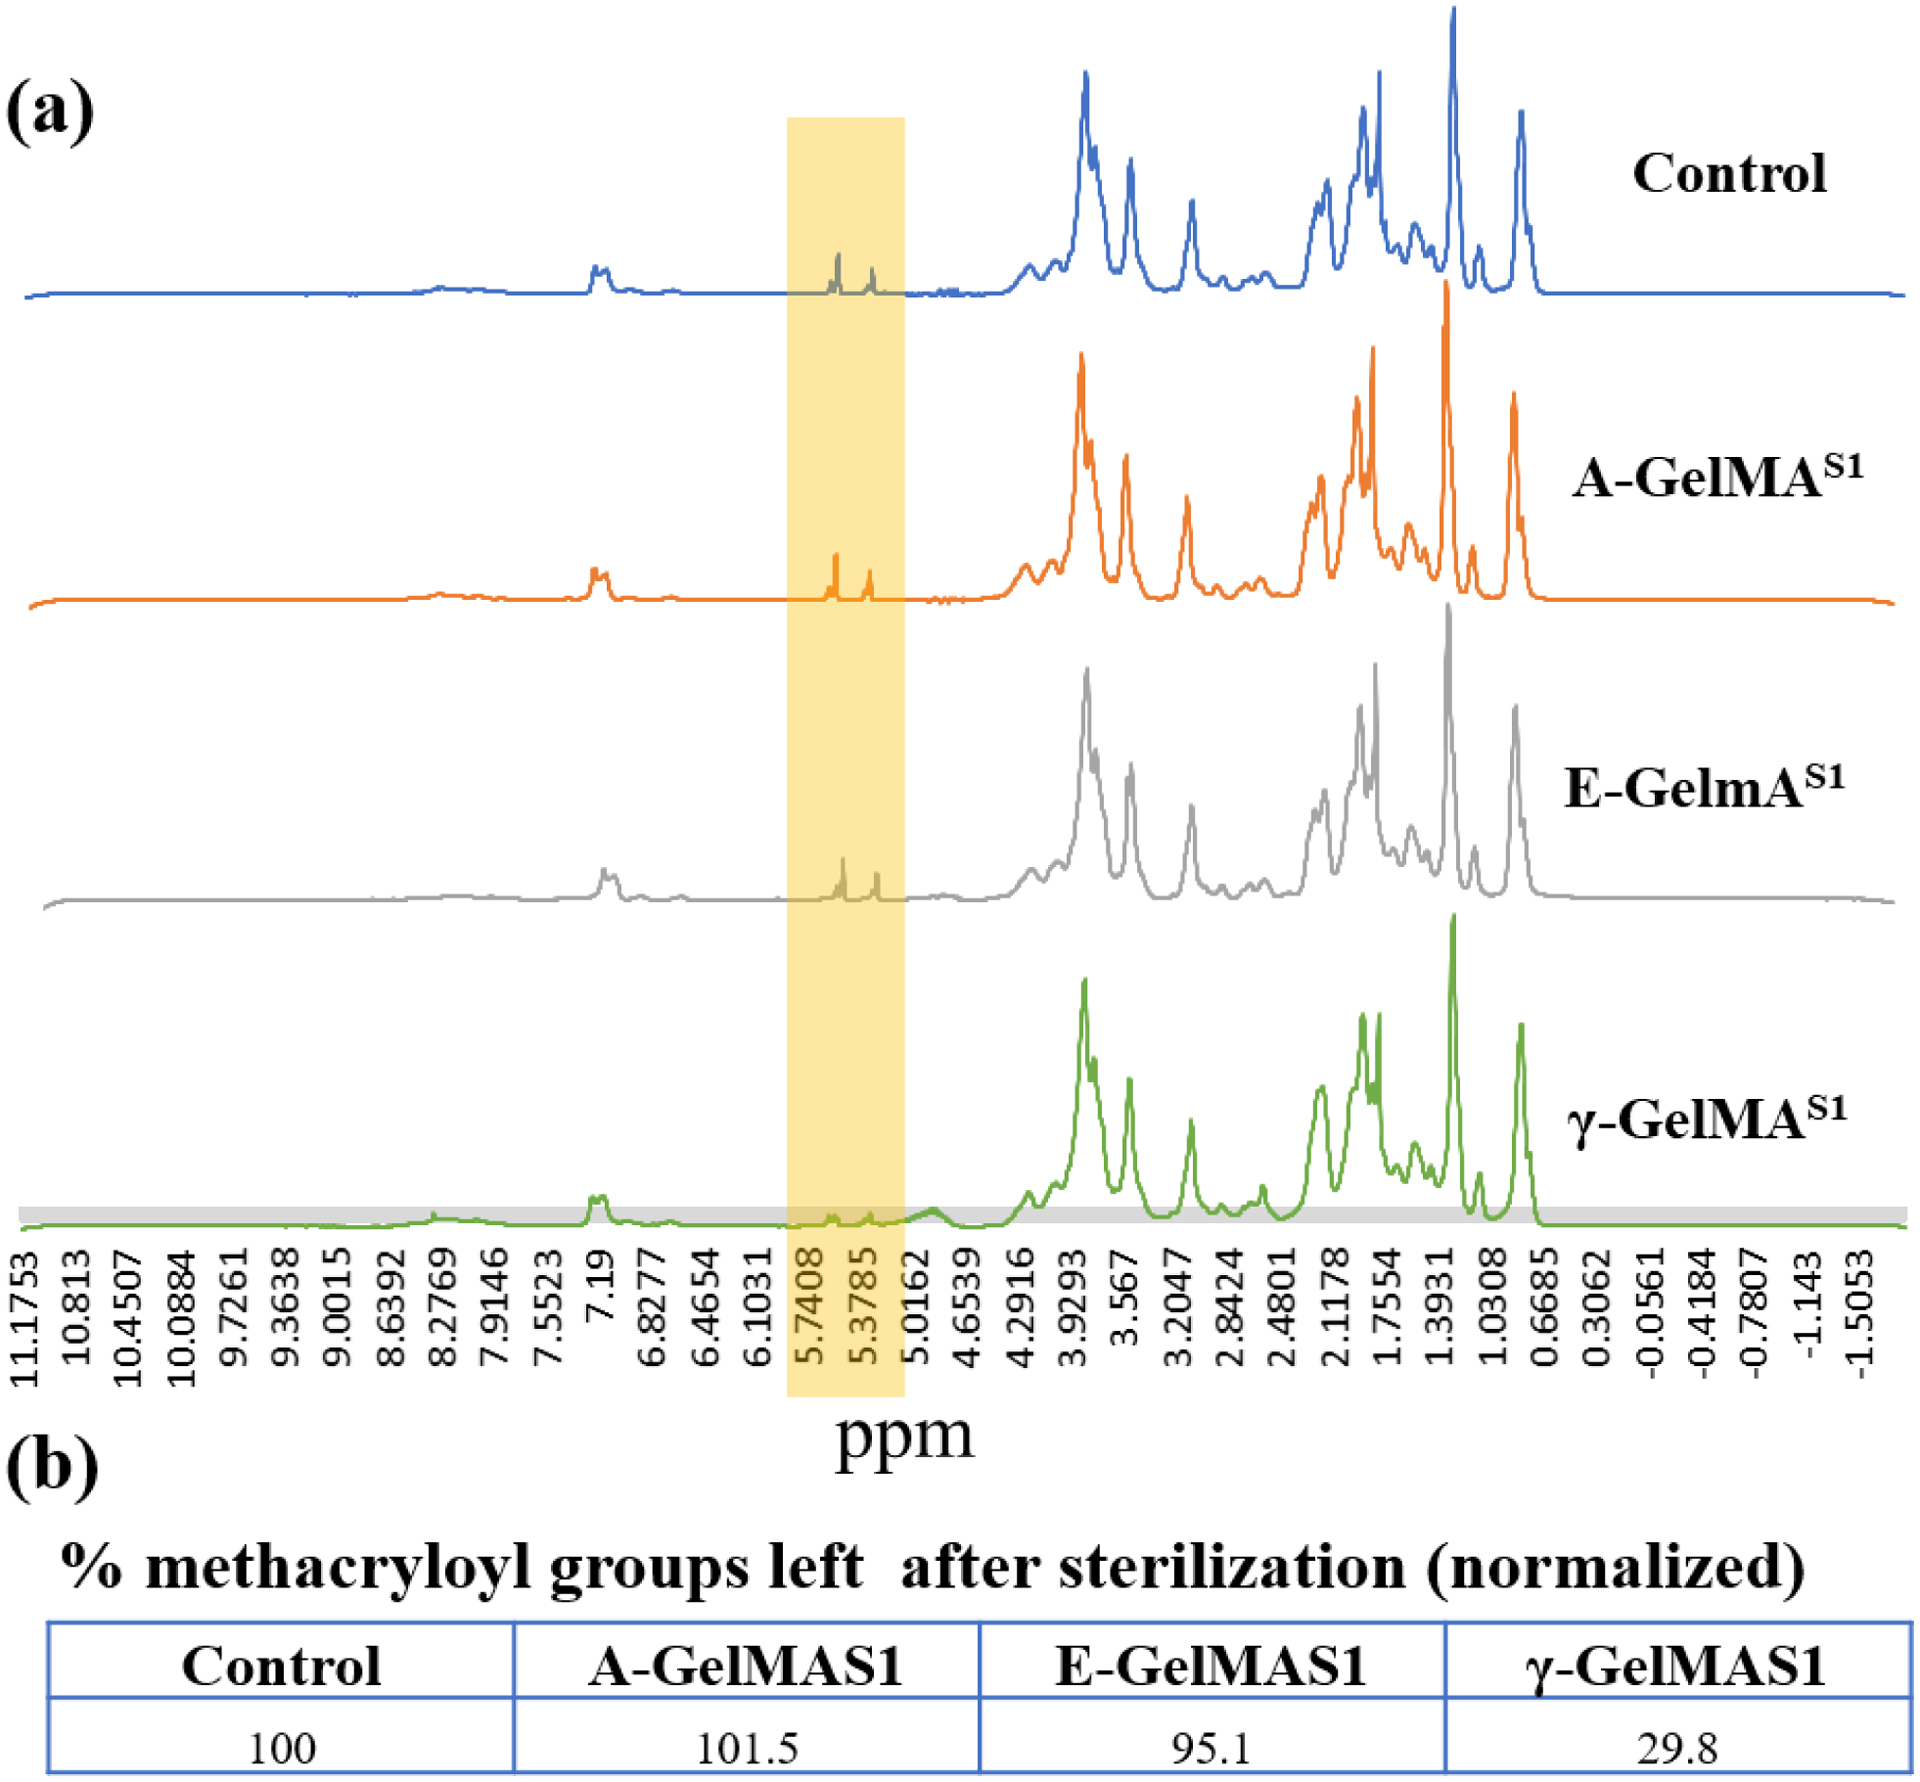
Figure 2:

(a) NMR showing the smaller peak of methacryloyl groups (The signal at δ = 5.3 and 5.6 ppm) on the GelMA after gamma sterilization at stage 1 compared to rest of the groups. (b) Relative area under the peak estimation to calculate the % methacryloyl groups left after sterilization. The data was normalized to the untreated control group.
