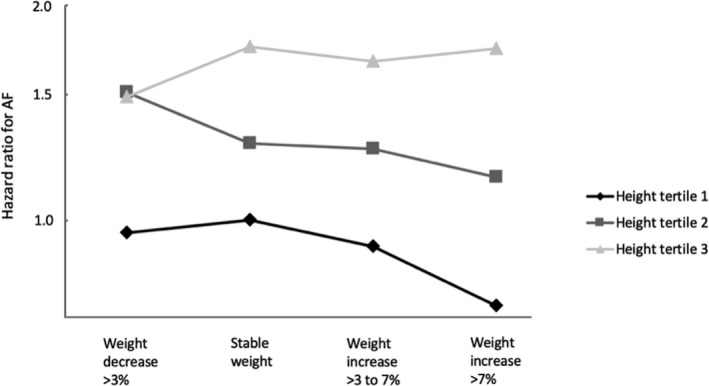
FIGURE 1.

Illustration of the risk of atrial fibrillation in categories of weight change, stratified by sex‐specific tertiles of height. Analysis adjusted for age, sex, s–cholesterol, education level, smoking, history of myocardial infarction, hypertension, diabetes, alcohol use, and physical activity, obtained at the second health examination. Participants in the lowest height tertile with stable weight were used as a reference group. Associations shown as hazard ratios. Associations between weight change and risk of AF are shown as black diamonds for participants in the lowest height tertile, as dark gray squares for participants in the middle height tertile, and as light gray triangles for participants in the highest height tertile
