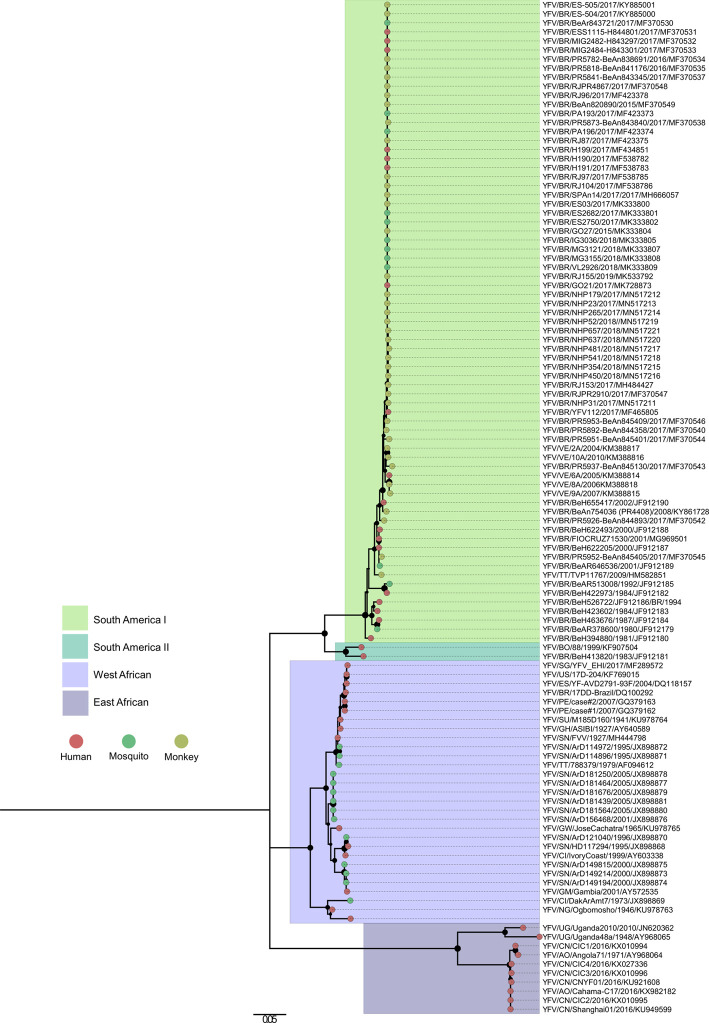
Figure 3. Phylogeny of yellow fever virus.
Phylogeny of YFV virus inferred using the maximum likelihood method. The tree was obtained from a sequence dataset of 112 isolates using the General Time Reversible (GTR) substitution model. Branches are labeled with bootstrap values representing the percentage of 1000 replicates in which the members of a given clade were predicted to relate in the same topography. The scale shows a genetic distance of 0.05 or a 5% nucleotide sequence divergence. Evolutionary analyses were conducted in MEGA7 [77]. Abbreviations: VE, Venezuela; BR, Brazil; PE, Peru; TT, Trinidad and Tobago; US, USA; SU, Suriname; EC, Ecuador; BO, Bolivia; SG, Singapore; ES, Spain; GH, Ghana; SN, Senegal; GW, Guinea-Bissau; CI, Côte d'Ivoire; GM, The Gambia; NG, Nigeria; UG, Uganda; CN, China; AO, Angola.

