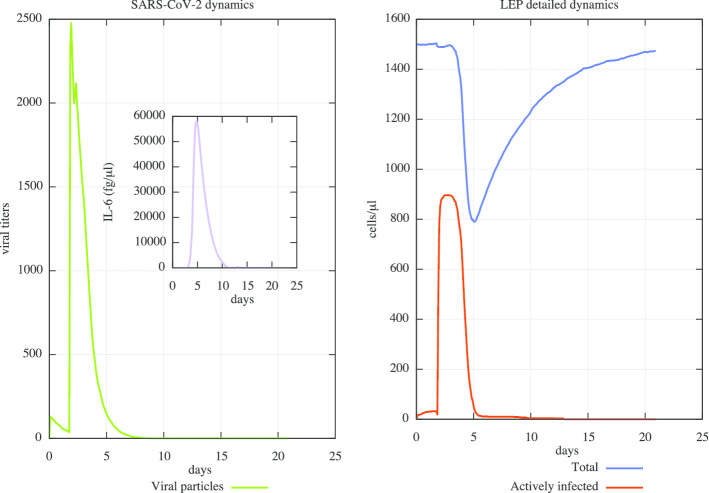
Fig. 2.
In silico SARS-CoV-2 viral dynamics and related CPE in a mild to moderate “mean in silico patient” scenario. In the left panel, one can observe the mild digital patient case in which a virus challenge dose of 0.1 multiplicity of infection (MOI) was administered at day 0 (green line). Peak viral titers are reached by 48 h post-inoculation. IL-6 dynamics and its related plasma levels (fg/μL) are also shown in the inner panel (purple line). In the right one, the dynamics of CPE on the lung infected cells is measured: they started at day 3.5 and peak around day 5. After 21 days, the simulated digital patient almost recovers from the infection. One can notice how UISS is capable to simulate, accordingly to the recent literature, the early viral clearance by day 10 post-onset in mild cases

