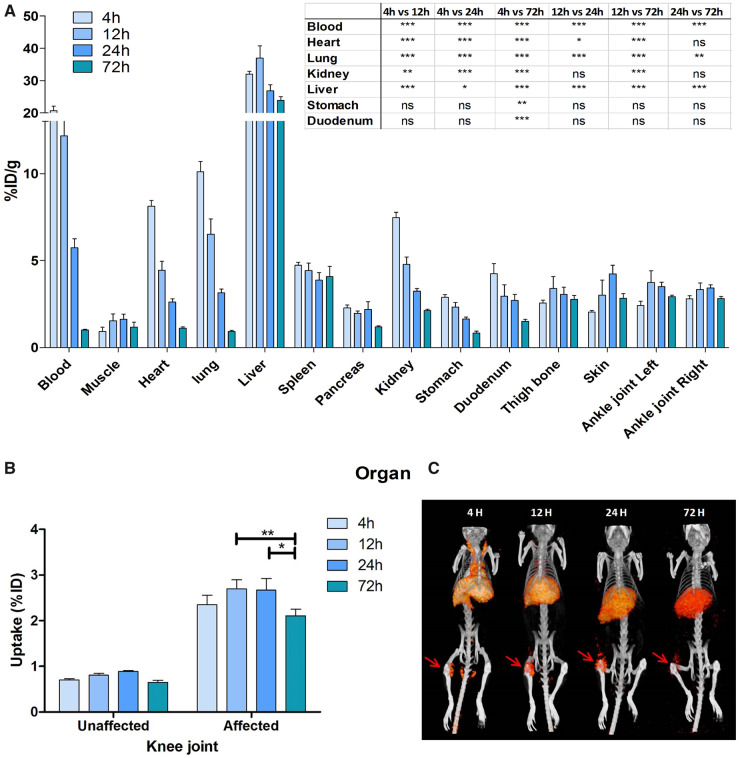
Fig. 3.
Biodistribution of [111In]In-DTPA-28H1-IRDye700DX at different time points in mice with AIA
(A) The tracer shows rapid clearance from the blood. (B) Tracer accumulation is higher in the arthritic knee joint than in the contralateral joint (P < 0.001 for all time points). (C) SPECT/CT imaging shows the same pattern as the biodistribution data, with high uptake in the inflamed right knee joint (red arrow) and the liver. Data are shown as mean (s.d.). Two-way analysis of variance with Bonferroni post-test. *P < 0.05, **P < 0.01, ***P < 0.001; n = 5 mice/group.

