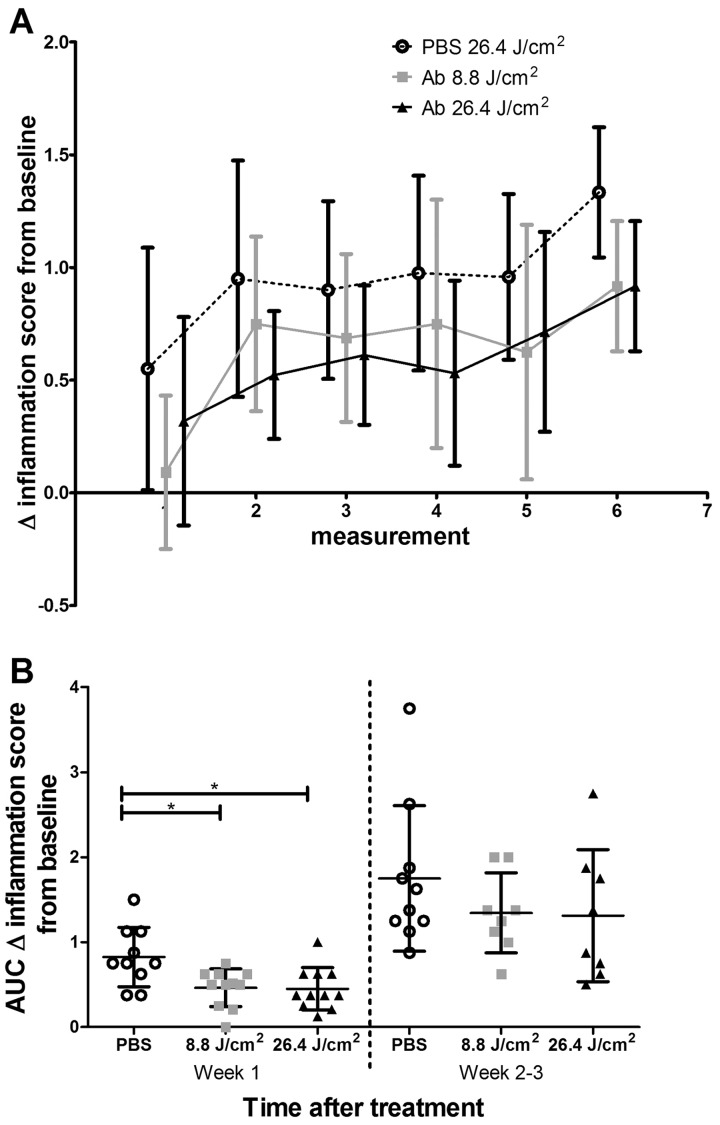
Fig. 5.
Development of collagen-induced arthritis after FAP-tPDT
(A) Change in inflammation score compared with baseline. (B) Area under the curve of the change in inflammation compared with baseline for the first two measurements and the later time points. Data are shown as mean (s.d.). n = 11 mice at baseline.

