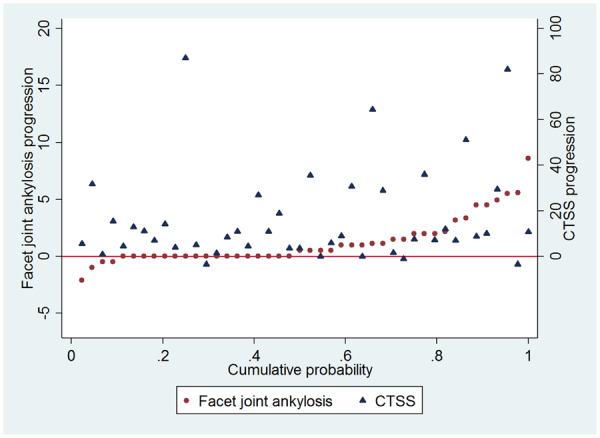
Fig. 3.

Cumulative probability plot showing 2-year progression of syndesmophytes and facet joint ankylosis
Syndesmophytes were scored with the Computed Tomography Syndesmophyte Score (CTSS). Facet joint ankylosis scores are mean progression scores of the two readers. The plot is ordered by the facet joint ankylosis progression scores. Dots and triangles on the same location on the X-axis belong to the same patient. The scale on the left side of the figure belongs to the facet joint ankylosis progression scores, the scale on the right belongs to the CTSS progression scores.
