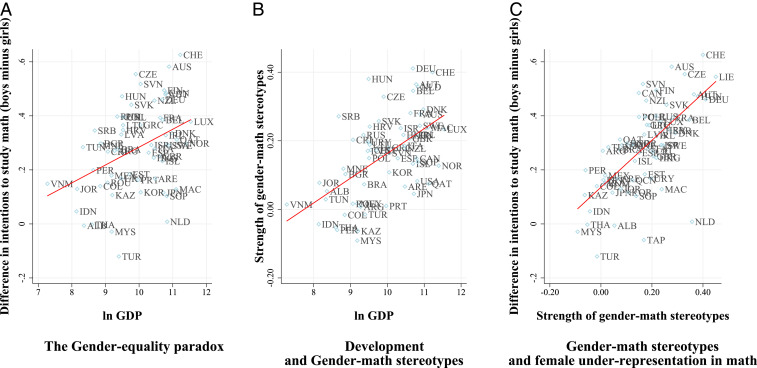
Fig. 1.
Relationships between economic development, GMS, and female underrepresentation in math-related fields. The figure shows scatter plots and linear fits of the relationships between the logarithm of GDP and the gender gap in intentions (A), between the logarithm of GDP and gender-math stereotypes (B), and between gender-math stereotypes and the gender gap in intentions (C).

