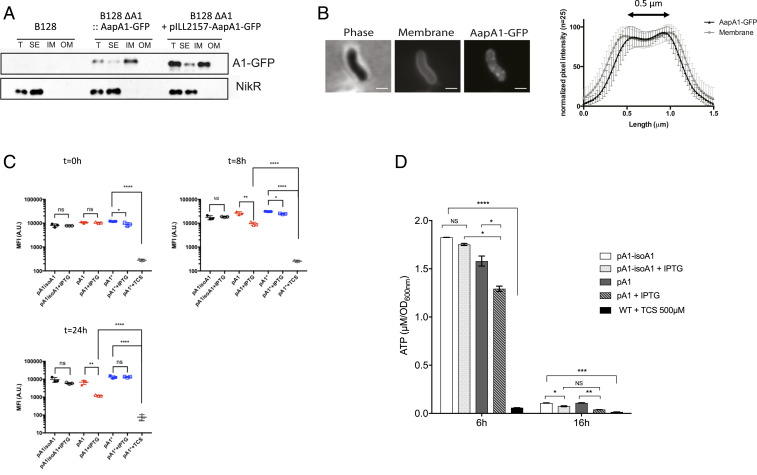
Fig. 2.
Analysis of the consequences of the AapA1 toxin targeting of the H. pylori inner membrane. (A) AapA1 toxin localizes to the H. pylori inner membrane. Western blot analysis of total extracts (T), soluble extracts (SE), inner membrane (IM), and outer membrane (OM) fractions prepared from H. pylori B128 strain expressing a GFP-tagged AapA1 toxin (AapA1−GFP) expressed either from the chromosome or from a plasmid (pILL2157) under the control of an IPTG-inducible promoter. Anti-NikR antibodies were used as a control of the cytoplasmic fraction. The fractionation procedure was validated as shown in SI Appendix, Fig. S2. (B) In live cells, AapA1−GFP localizes as discrete foci at the H. pylori membrane. Strain B128 expressing the AapA1−GPF fusion protein was analyzed on agarose pads by fluorescence microscopy 6 h after IPTG induction. Membranes were stained with TMA-DPH lipophilic dye. The membrane association of AapA1−GPF was quantified by measuring the fluorescence intensity profile perpendicular to the length axis of H. pylori. The graph shows the average fluorescence intensity profiles with SD (n = 25). The fluorescence maxima separated by 0.5 μm correlate with the H. pylori cell width. (Scale bar, 1 μm.) (C) Analysis of the effects of the AapA1 toxin on H. pylori membrane potential. MitoTracker Red CMXRos, a membrane potential reactive dye, was used to analyze live H. pylori B128 strains expressing each of the three plasmids illustrated in Fig. 1. Samples were taken at 0, 8, and 24 h postinduction and stained with MitoTracker Red CMXRos, and the PMF was measured as the mean fluorescence intensity (MFI) by flow cytometry. The cell population distribution histograms are presented in SI Appendix, Fig. S3. Cells expressing the toxin (pA1) present a moderate fluorescence reduction at 8 h that was more pronounced at 24 h of culture. This is indicative of the absence of major disturbance of their membrane potential. No changes were observed in cells containing either pA1−isoA1 or pA1* plasmid. As a control, pA1*-bearing cells were treated with 500 μM TCS, a protonophore active on H. pylori, resulting in a massive loss of membrane potential. The experiment was performed three times. The Student’s t test was used to determine significant differences of the means of the data. Error bars represent the SD, with * corresponding to P < 0.05, ** to P < 0.01, and **** to P < 0.0001, indicating that the mean values are significantly different, and with NS corresponding to nonsignificant (P > 0.05). (D) Measurement of intracellular ATP content. Intracellular ATP was extracted from B128 strains harboring pA1−IsoA1 or pA1 at 6 or 16 h postinduction growth in the presence or absence of IPTG. B128 WT strain treated with 500 μM TCS protonophore was used as a control of PMF dissipation. ATP concentrations were determined using a luciferase-based assay (BacTiter-Glo, Promega). Results from three independent experiments performed in triplicate are shown. After 6 h of culture, IPTG induction had a moderate effect on cellular ATP content of the pA1 strain as compared to the drastic consequences observed with the TCS control. After 16 h postinduction, both strains presented a strong drop in overall ATP content, and IPTG induction caused an additional minor decrease. The Student’s t test was used to determine significant differences of the means of the data. Error bars represent the SD, with * corresponding to P < 0.05, ** to P < 0.01, *** to P < 0.001, and **** to P < 0.0001, indicating that the mean values are significantly different, and with NS corresponding to nonsignificant (P > 0.05).

