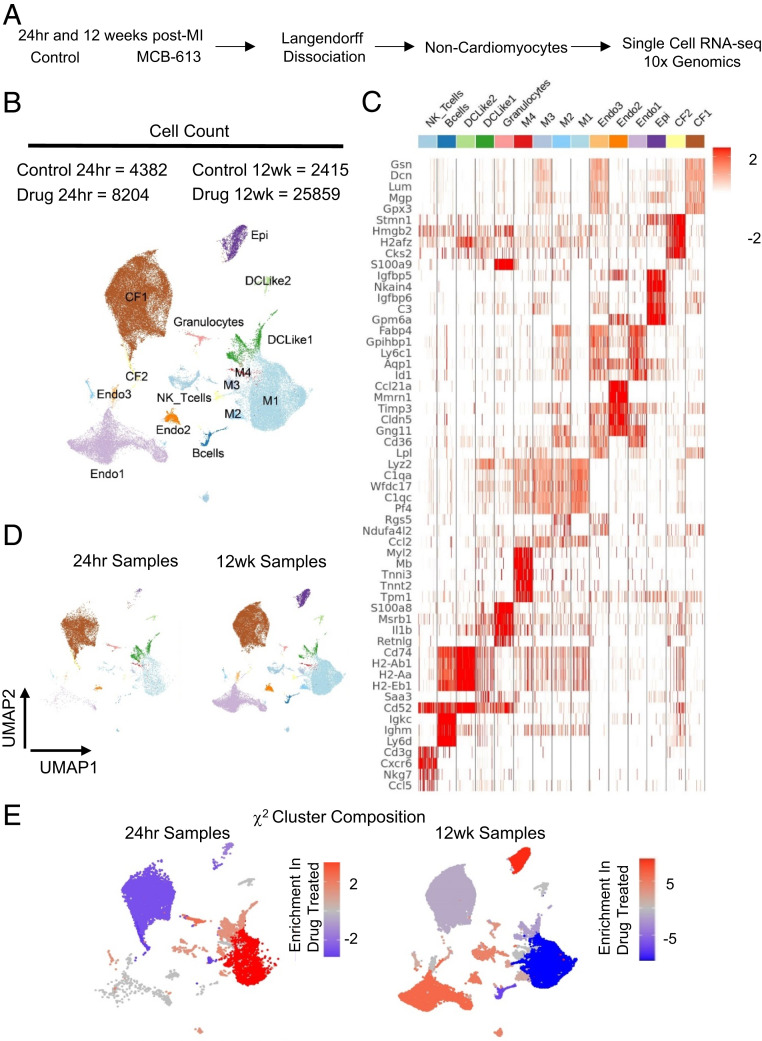
Fig. 2.
RNA transcriptional profiling of cardiac cells 24 h and 12 wk post-MI. (A) Schematic representation of isolation procedures to obtain noncardiomyocytes for single cell RNA-seq analysis from control-treated and MCB-613-treated mice 24 h and 12 wk post-MI. n = 2 hearts/group. (B) UMAP plot of all cell populations identified by unsupervised clustering of single cell transcriptional data. Each dot indicates a single cell. Nonmacrophage immune cells (DC-like 1to 3), B cells, T cells, NK cells, granulocytes, macrophages (M1 to 4), endothelial cells (Endo1 to 3), cardiac fibroblasts (CF1 to 2), and epicardial cells. (C) Heat map of top differentially expressed genes in each cell cluster. (D) UMAP plot of subclustered cells at 24 h and 12 h. (E) The χ2 cluster composition analysis of cells from MCB-613 compared to control at 24 h and 12 wk post-MI.

