Fig. 3.
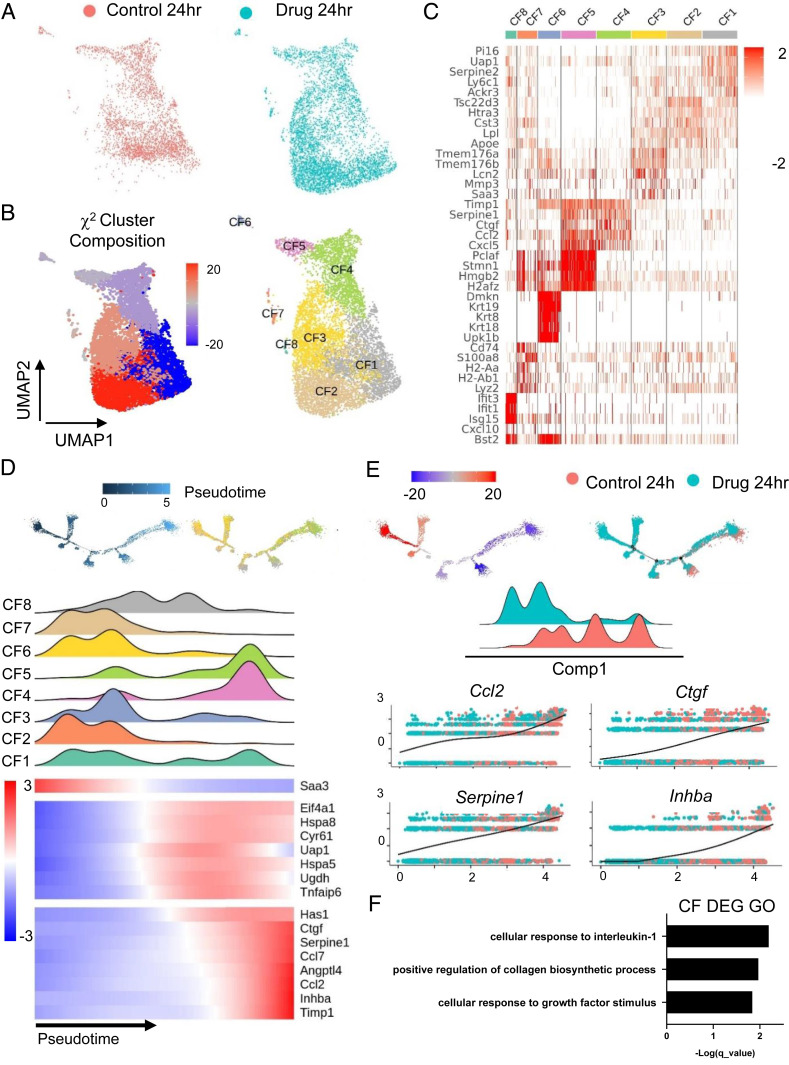
Single cell analysis of fibroblast cells 24 h post-MI reveals that the MCB-613 protective response is associated with decreased fibroblast differentiation, decreased fibrosis, and Il-1 response. (A) UMAP plot of fibroblasts from control (salmon) and MCB-613 (aqua) 24 h post-MI. (B) χ2 cluster composition analysis of subclustered fibroblasts from MCB-613 compared to control at 24 h post-MI (Left). UMAP plot of fibroblast subclusters 24 h post-MI (Right). (C) Heat map showing top five differentially expressed genes. (D) Pseudotime trajectory for cardiac fibroblasts 24 h post-MI (Left). Pseudotime trajectory colored according to subcluster identity (Right). Density plots according to fibroblast subclusters and heatmap showing dynamics of gene expression for subclusters across the trajectory (Bottom). (E) Pseudotime trajectory colored according to χ2 cluster composition (Left) and treatment condition (Right). Density plot according to treatment condition. Gene expression trends for individual genes across the pseudotime trajectory (Bottom). (F) GO term analysis of differentially expressed genes from fibroblasts in control compared to MCB-613.

